
Optimizing Onboarding for Success
Using experimentation to accelerate activation and conversion.
Problem
At AgencyAnalytics, a reporting platform for marketing agencies, we were seeing a decline in user activation and trial-to-paid conversions.
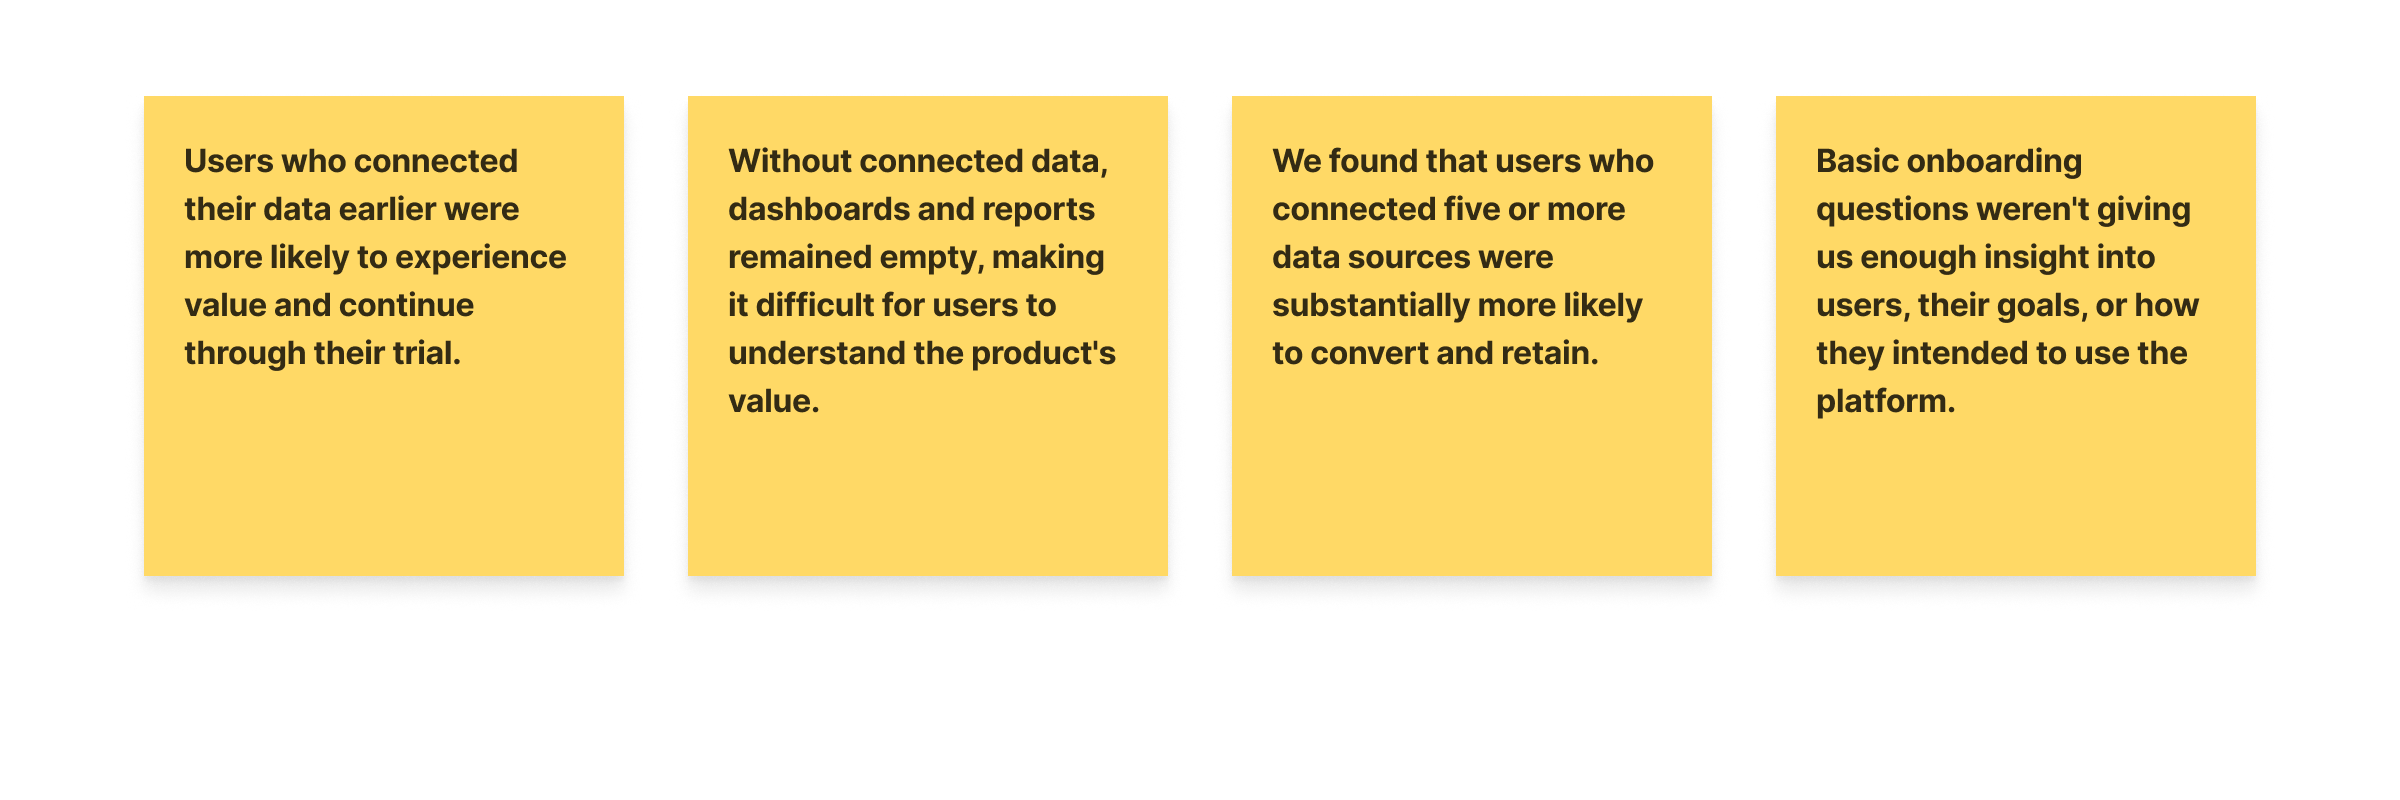
Through our initial research, we found a key problem: users weren't seeing enough value early in their trial. AgencyAnalytics becomes much more valuable once users connect their marketing data sources, but many users weren't connecting their data early enough in the trial experience.
Without connected data, dashboards and reports remained empty, making it difficult for users to experience the product's value.
Solution
We redesigned the onboarding experience to help users reach the product's "aha moment" faster.
Through a series of experiments, we introduced contextual data-source selection and ultimately created a Smart Dashboard that automatically populated a user's account with demo widgets based on the data sources they selected during onboarding.
The dashboard gave users an immediate preview of what AgencyAnalytics could do with their data, while clear calls-to-action encouraged them to connect their own data sources.
This helped users experience value earlier, increased activation, and ultimately contributed to a 25.5% increase in trial-to-paid conversions.
Role
I served as the Senior Product Designer, leading the design process across multiple onboarding experiments. I conducted research, mapped user journeys and funnels, created wireframes and prototypes, and collaborated closely with product managers, data analysts, developers, and marketing.
I also created experiment documentation and dashboards to define hypotheses, track results, and understand whether each change was having the intended impact.
Team
Product Manager, Product Designer, Engineering Manager, 4 Developers, Product Marketing Manager
My Process
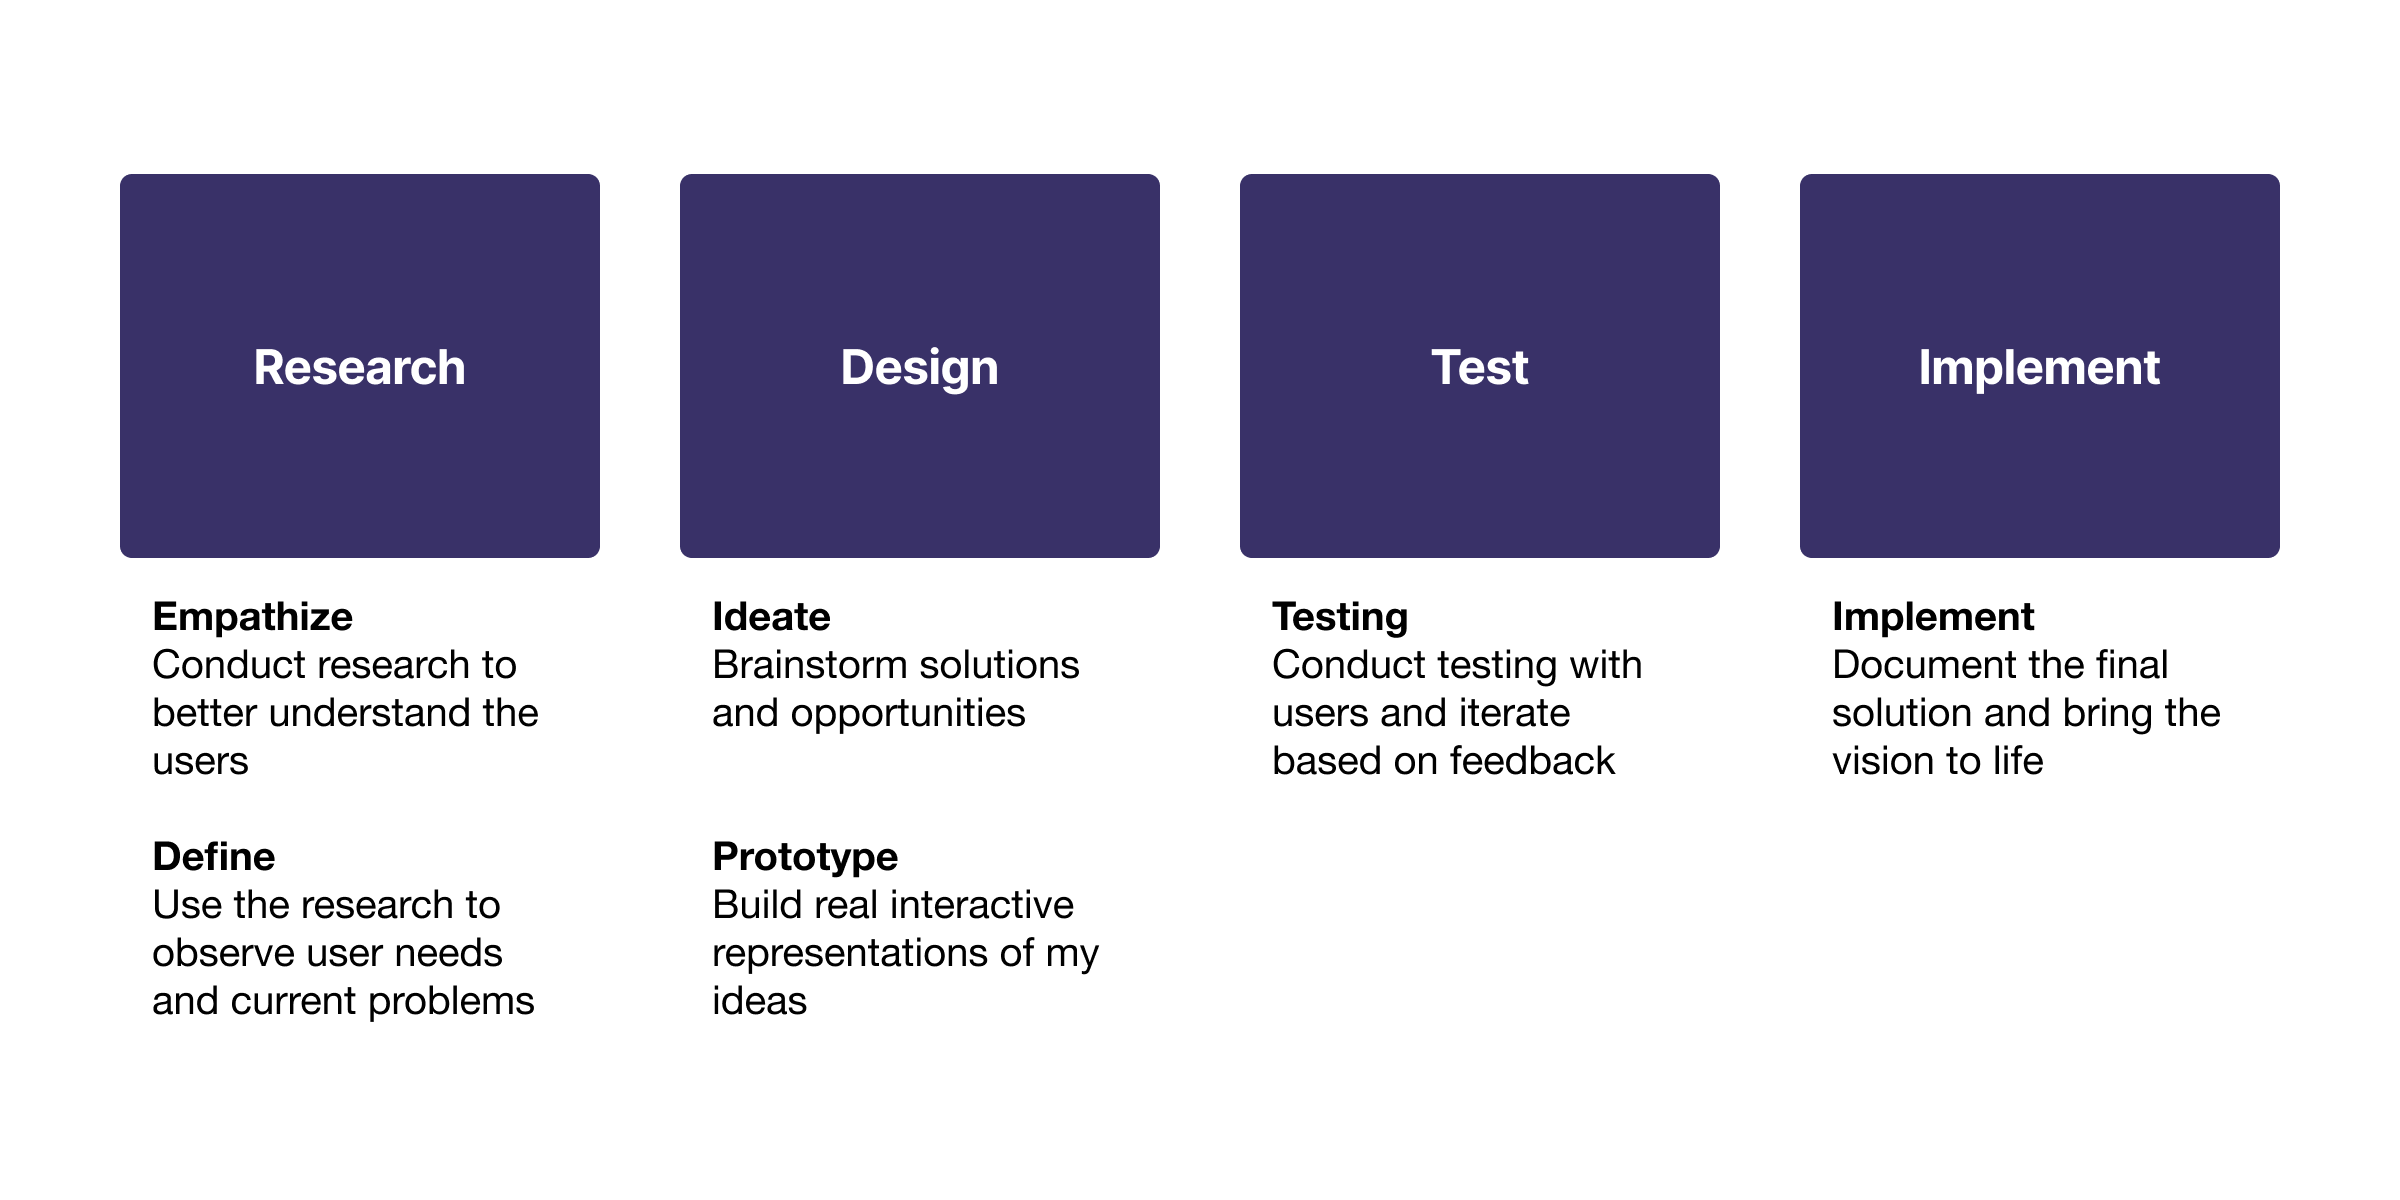
My process revolves around deeply understanding the user and their problems.

Research
Understanding Where Users Were Dropping Off
Because onboarding touches nearly every new customer, we wanted to understand exactly where users were getting stuck and which actions were most closely associated with activation and conversion.
I partnered with product managers and data analysts to map our onboarding funnels and identify areas where users were dropping off.
We looked at the relationship between onboarding actions, activation, data-source connections, and conversion to better understand what behaviors were associated with successful customers.
A few insights quickly emerged:
Understanding Who Was Coming Through the Door
While investigating our conversion decline, we also questioned whether we were attracting the right audience through our marketing efforts.
Our existing onboarding only captured basic information such as company size, which didn't give us enough insight into who was actually trialing the product or what they intended to use it for.
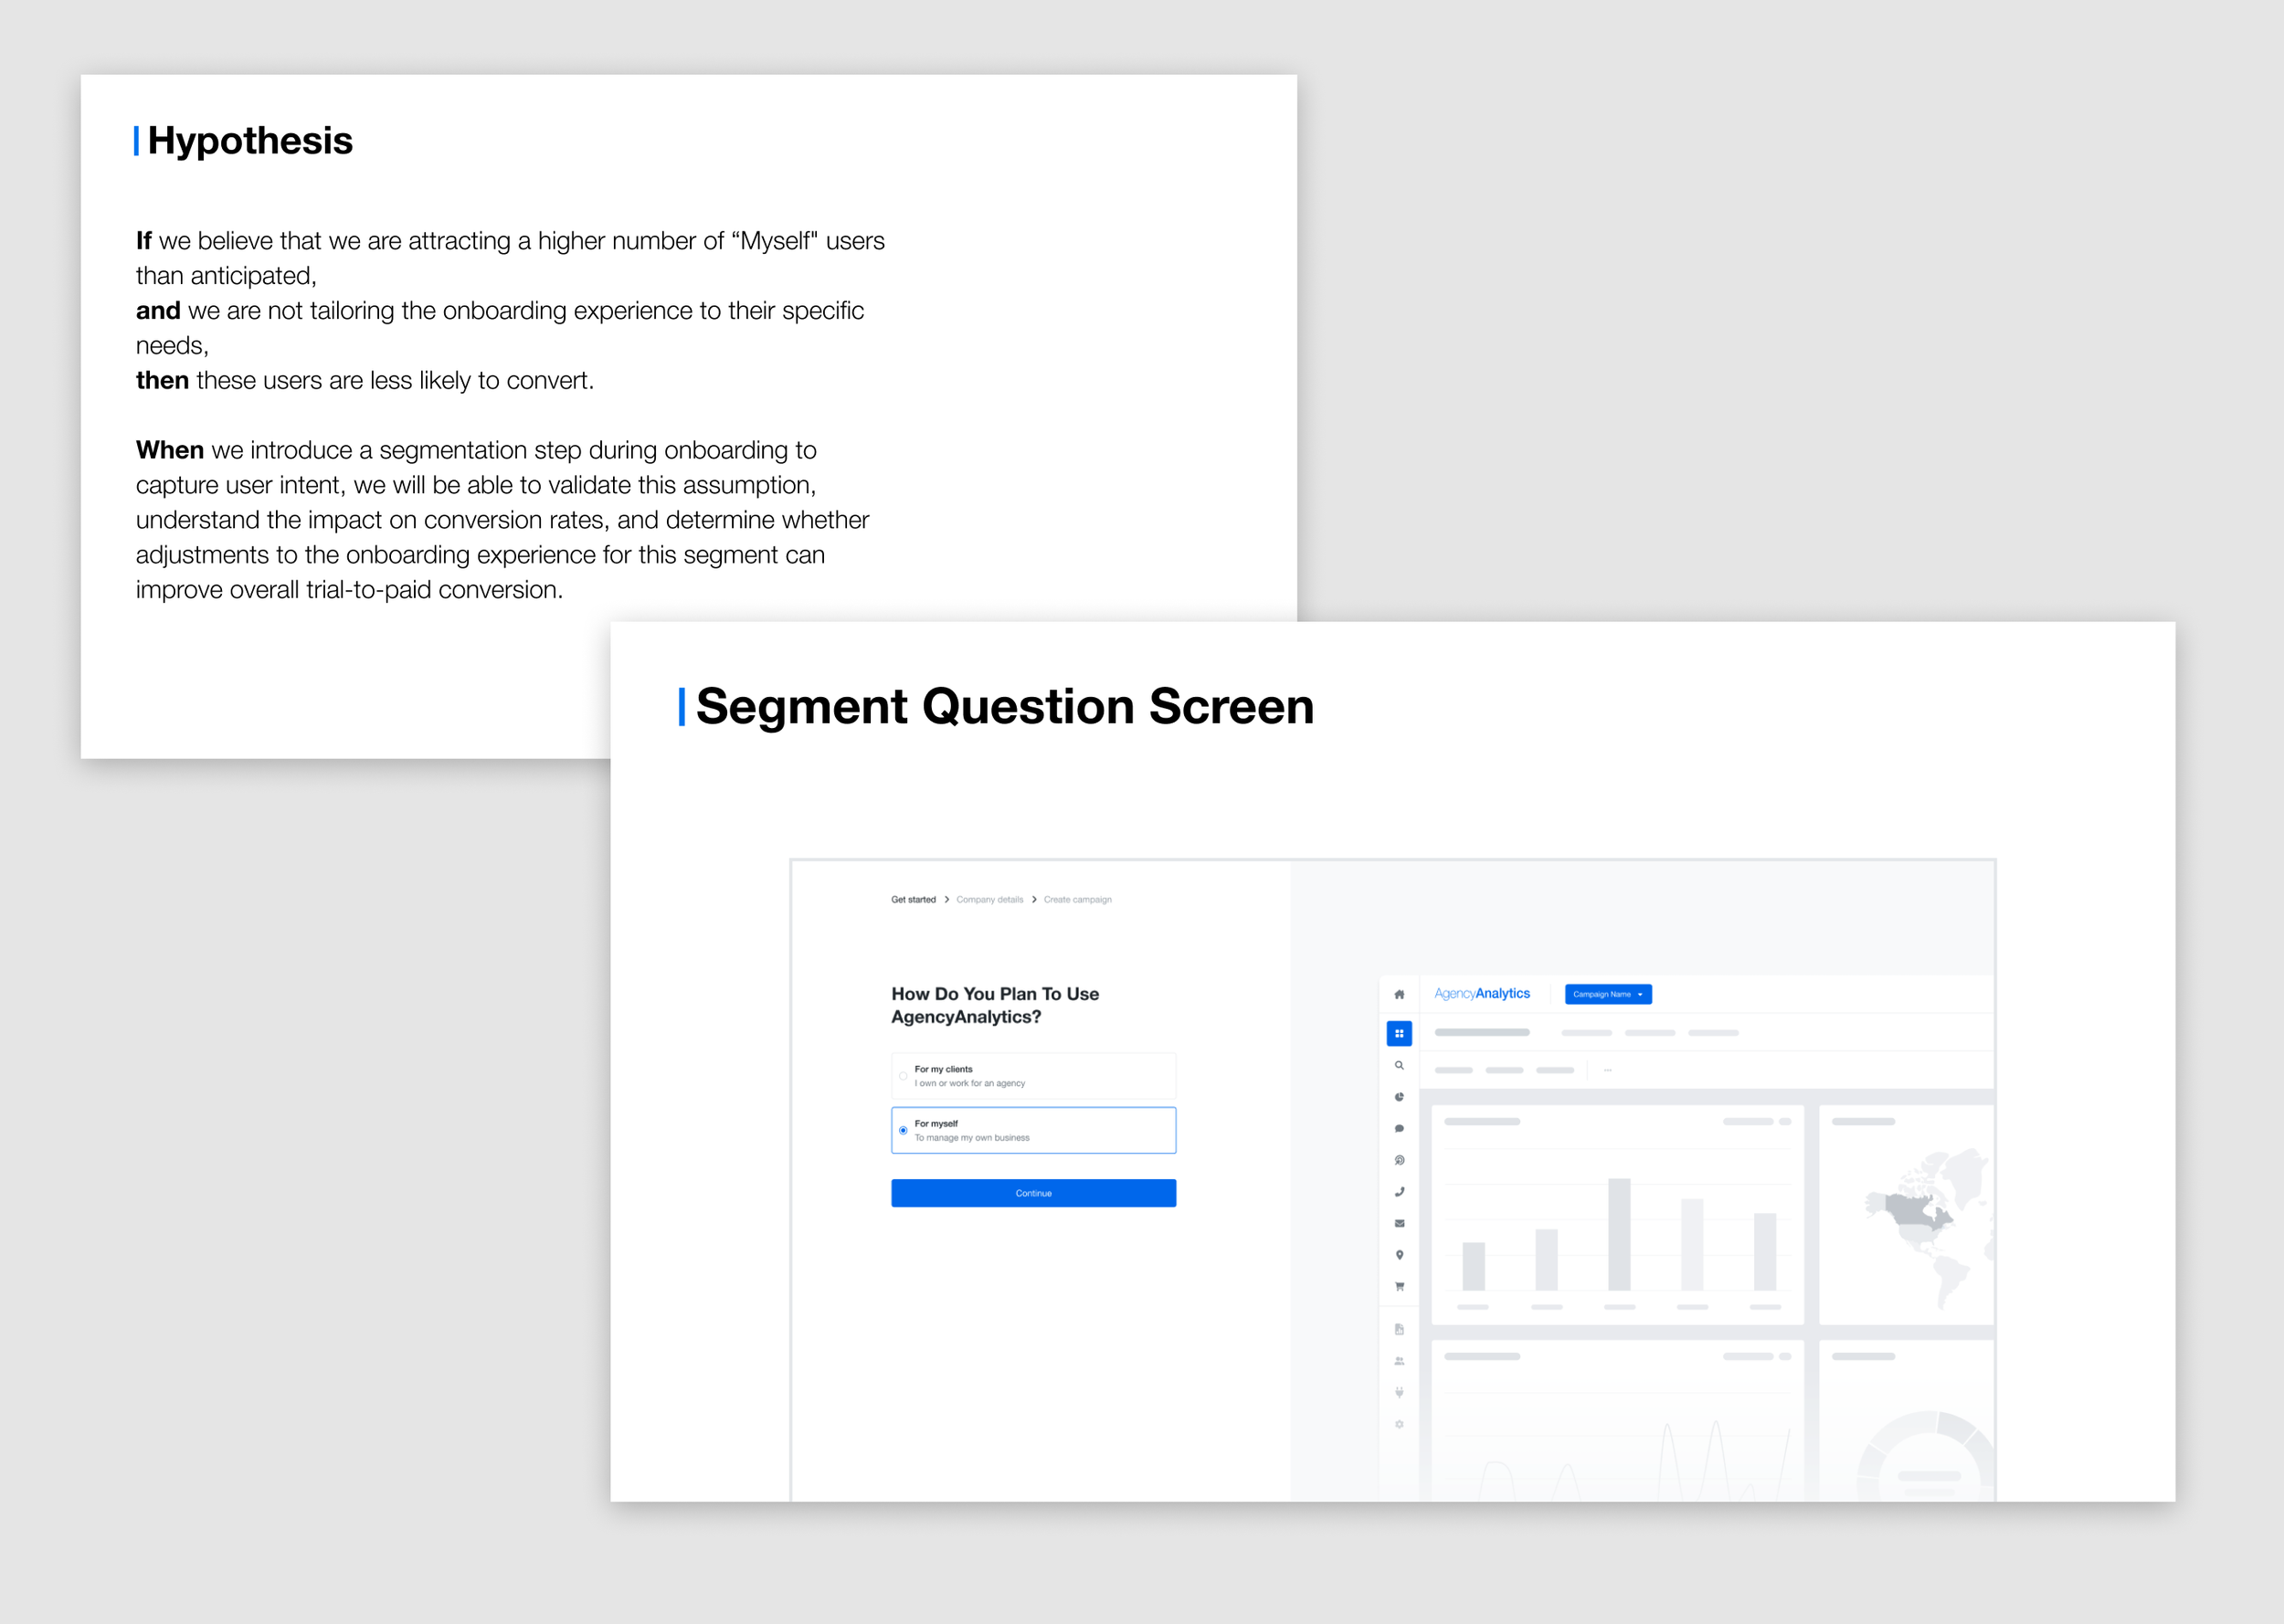
I added a segmentation question to help us understand who was coming through the pipeline and whether we were attracting the right audience.
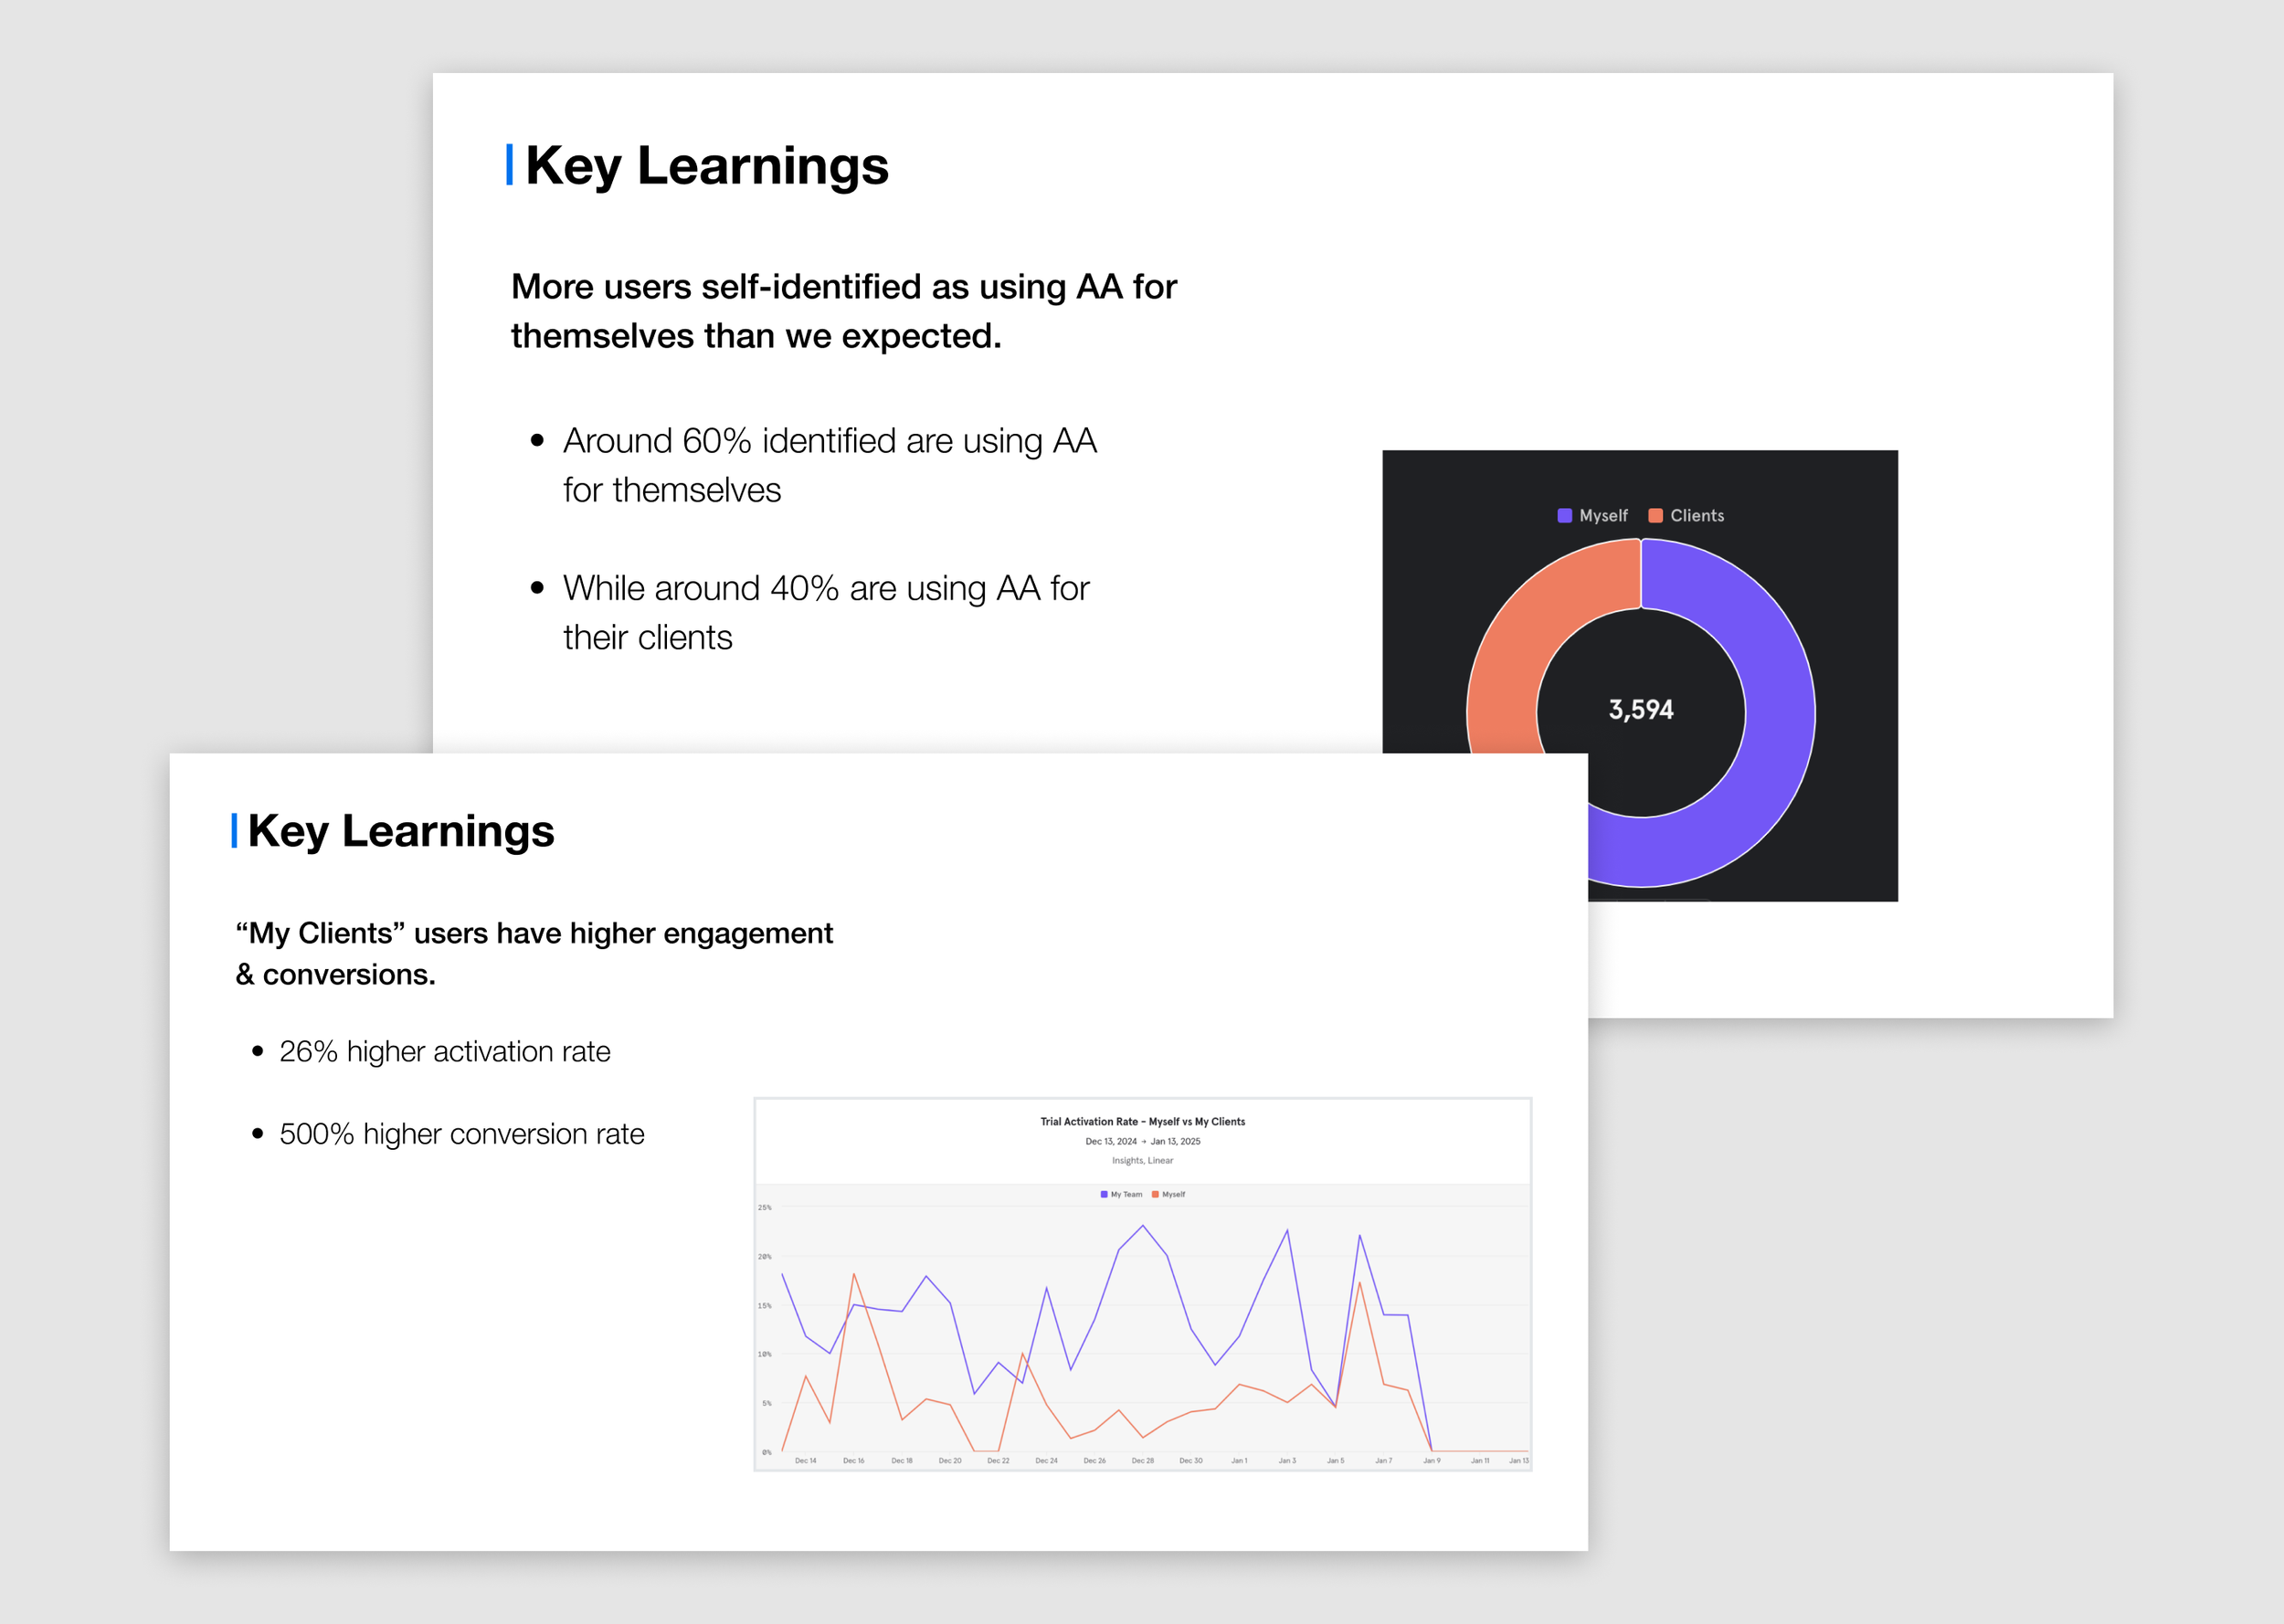
Segment Question Results
Around 60% of users identified themselves as using AgencyAnalytics for their own business, while approximately 40% said they were using it for clients.
This gave us a much clearer picture of the audience entering the funnel and raised important questions around our ICP, marketing strategy, and even the future direction of the product.
Marketing began using these insights to refine their acquisition strategy, while product and marketing started working toward more detailed segmentation and ICP definitions.
Competitive analysis
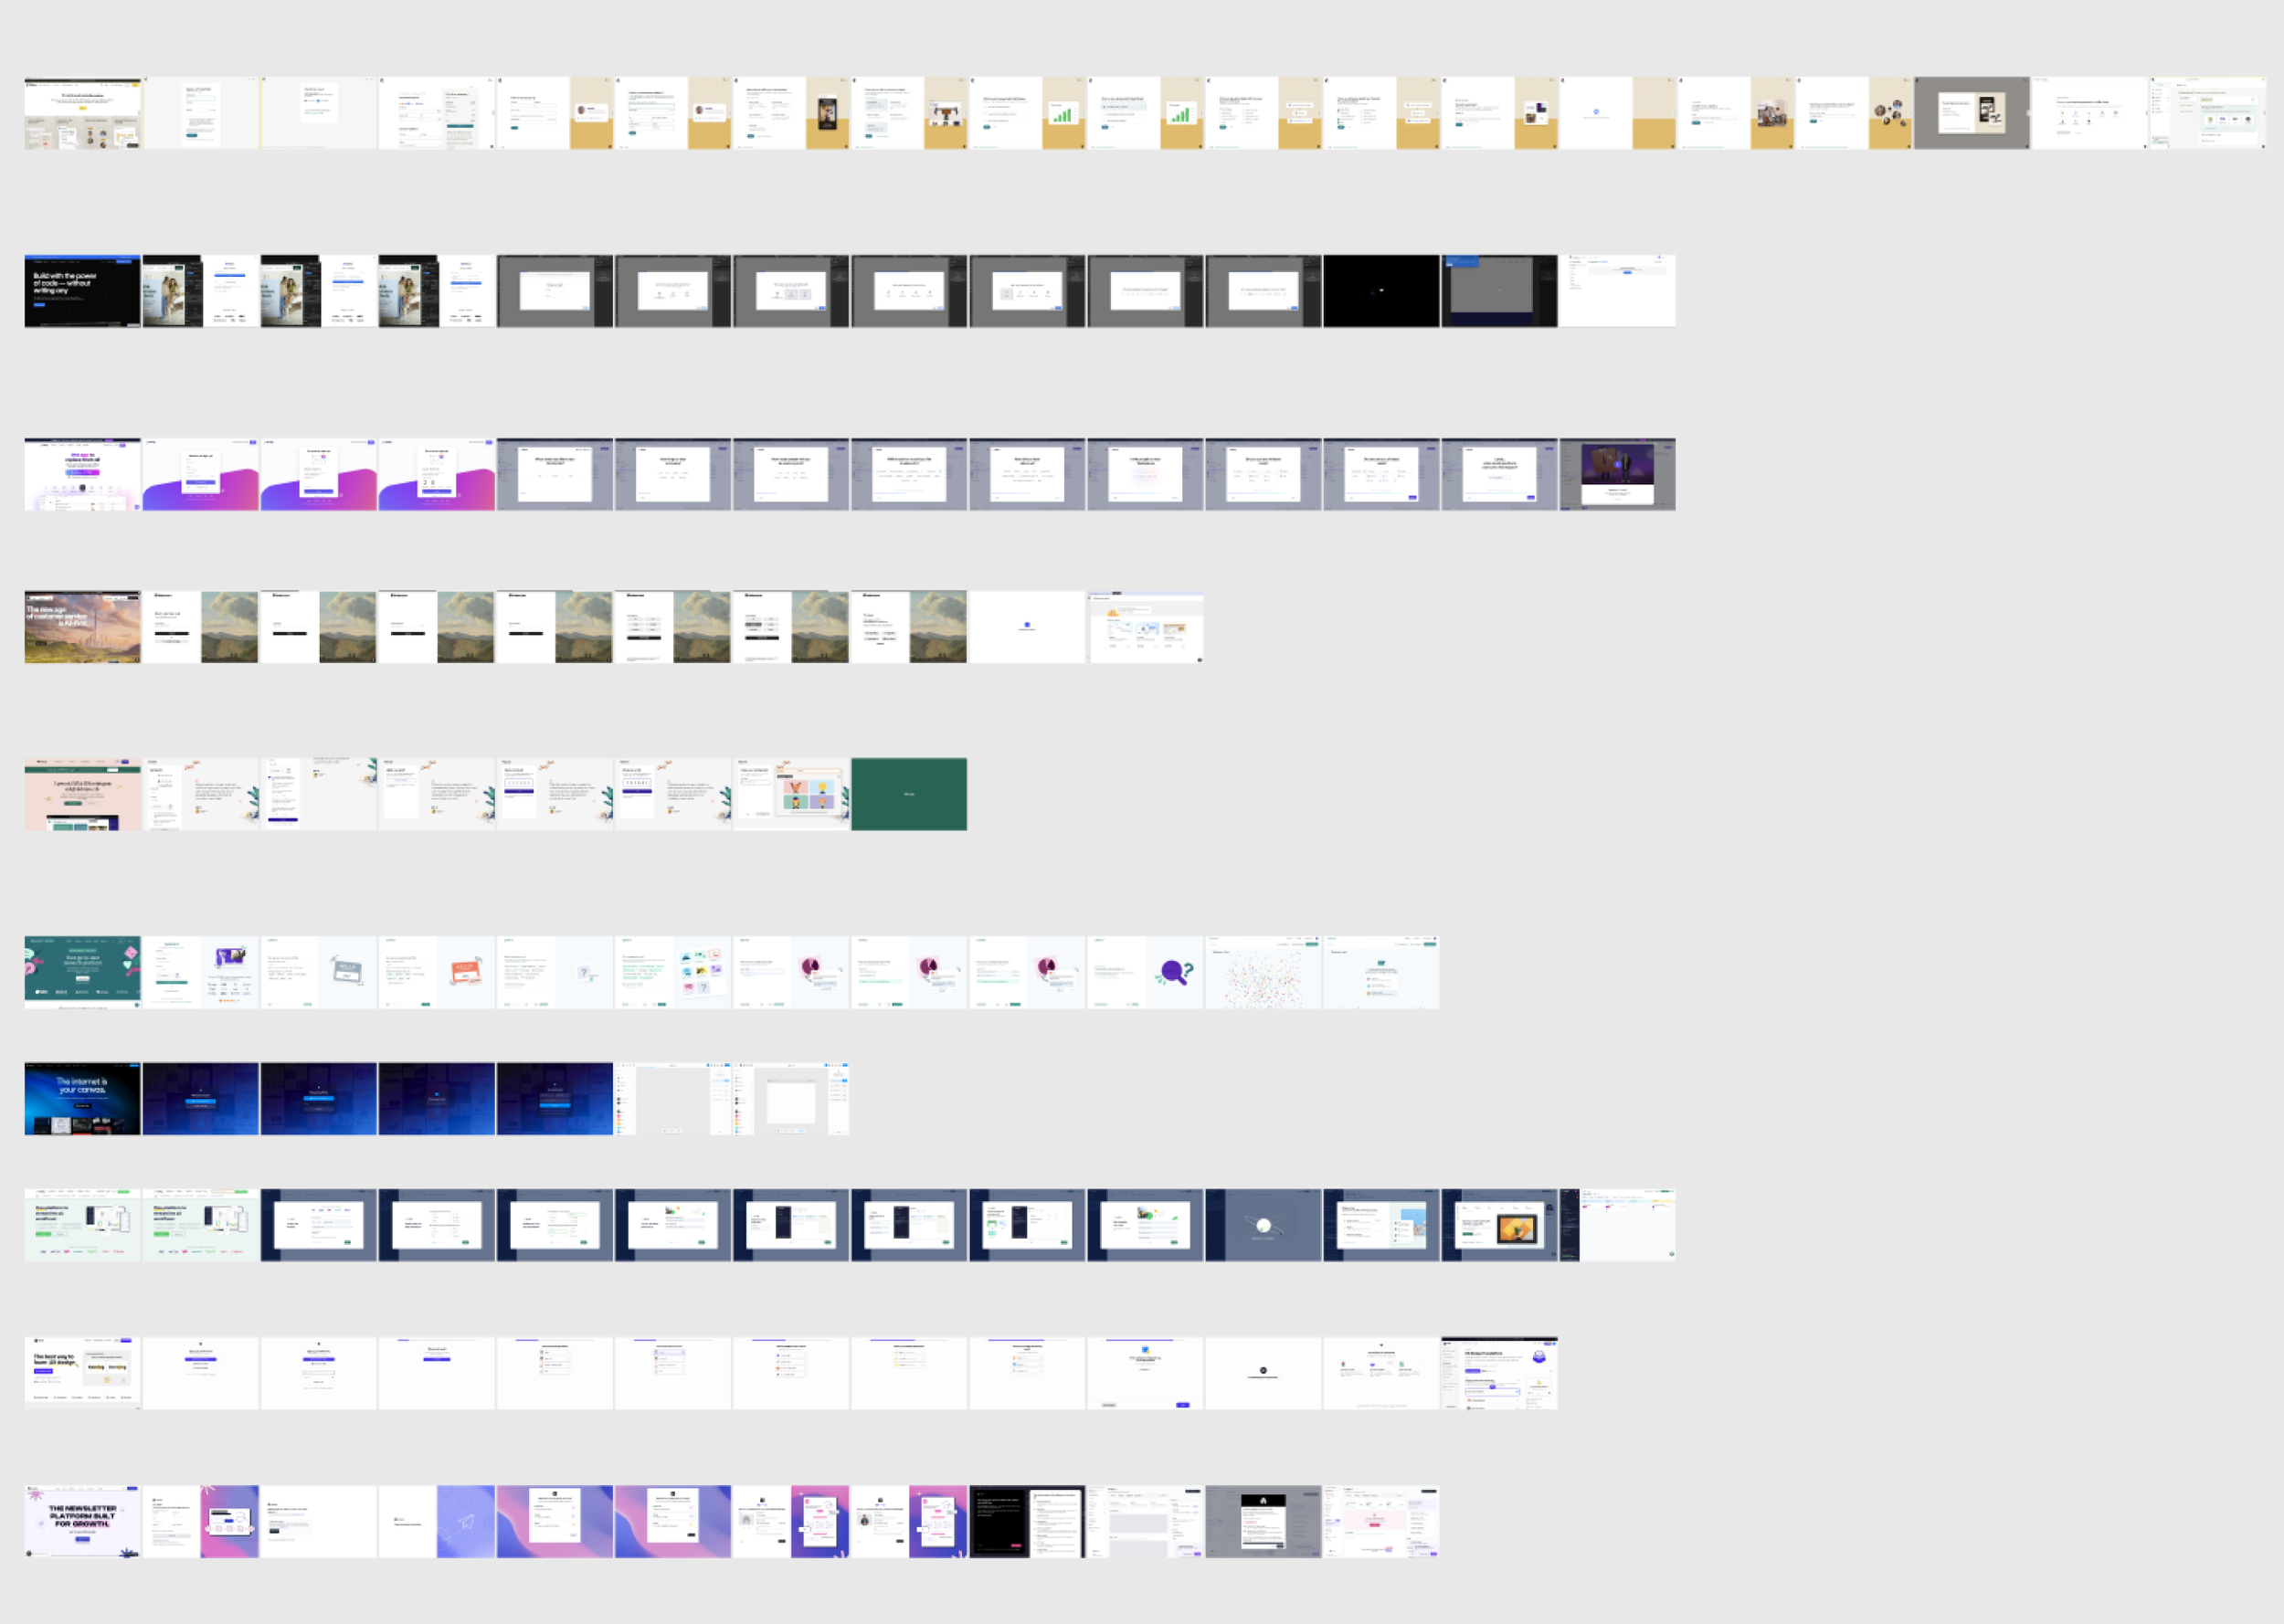
I researched how other products approached onboarding and account setup.
A common pattern stood out: single-question onboarding experiences rather than presenting users with large forms.
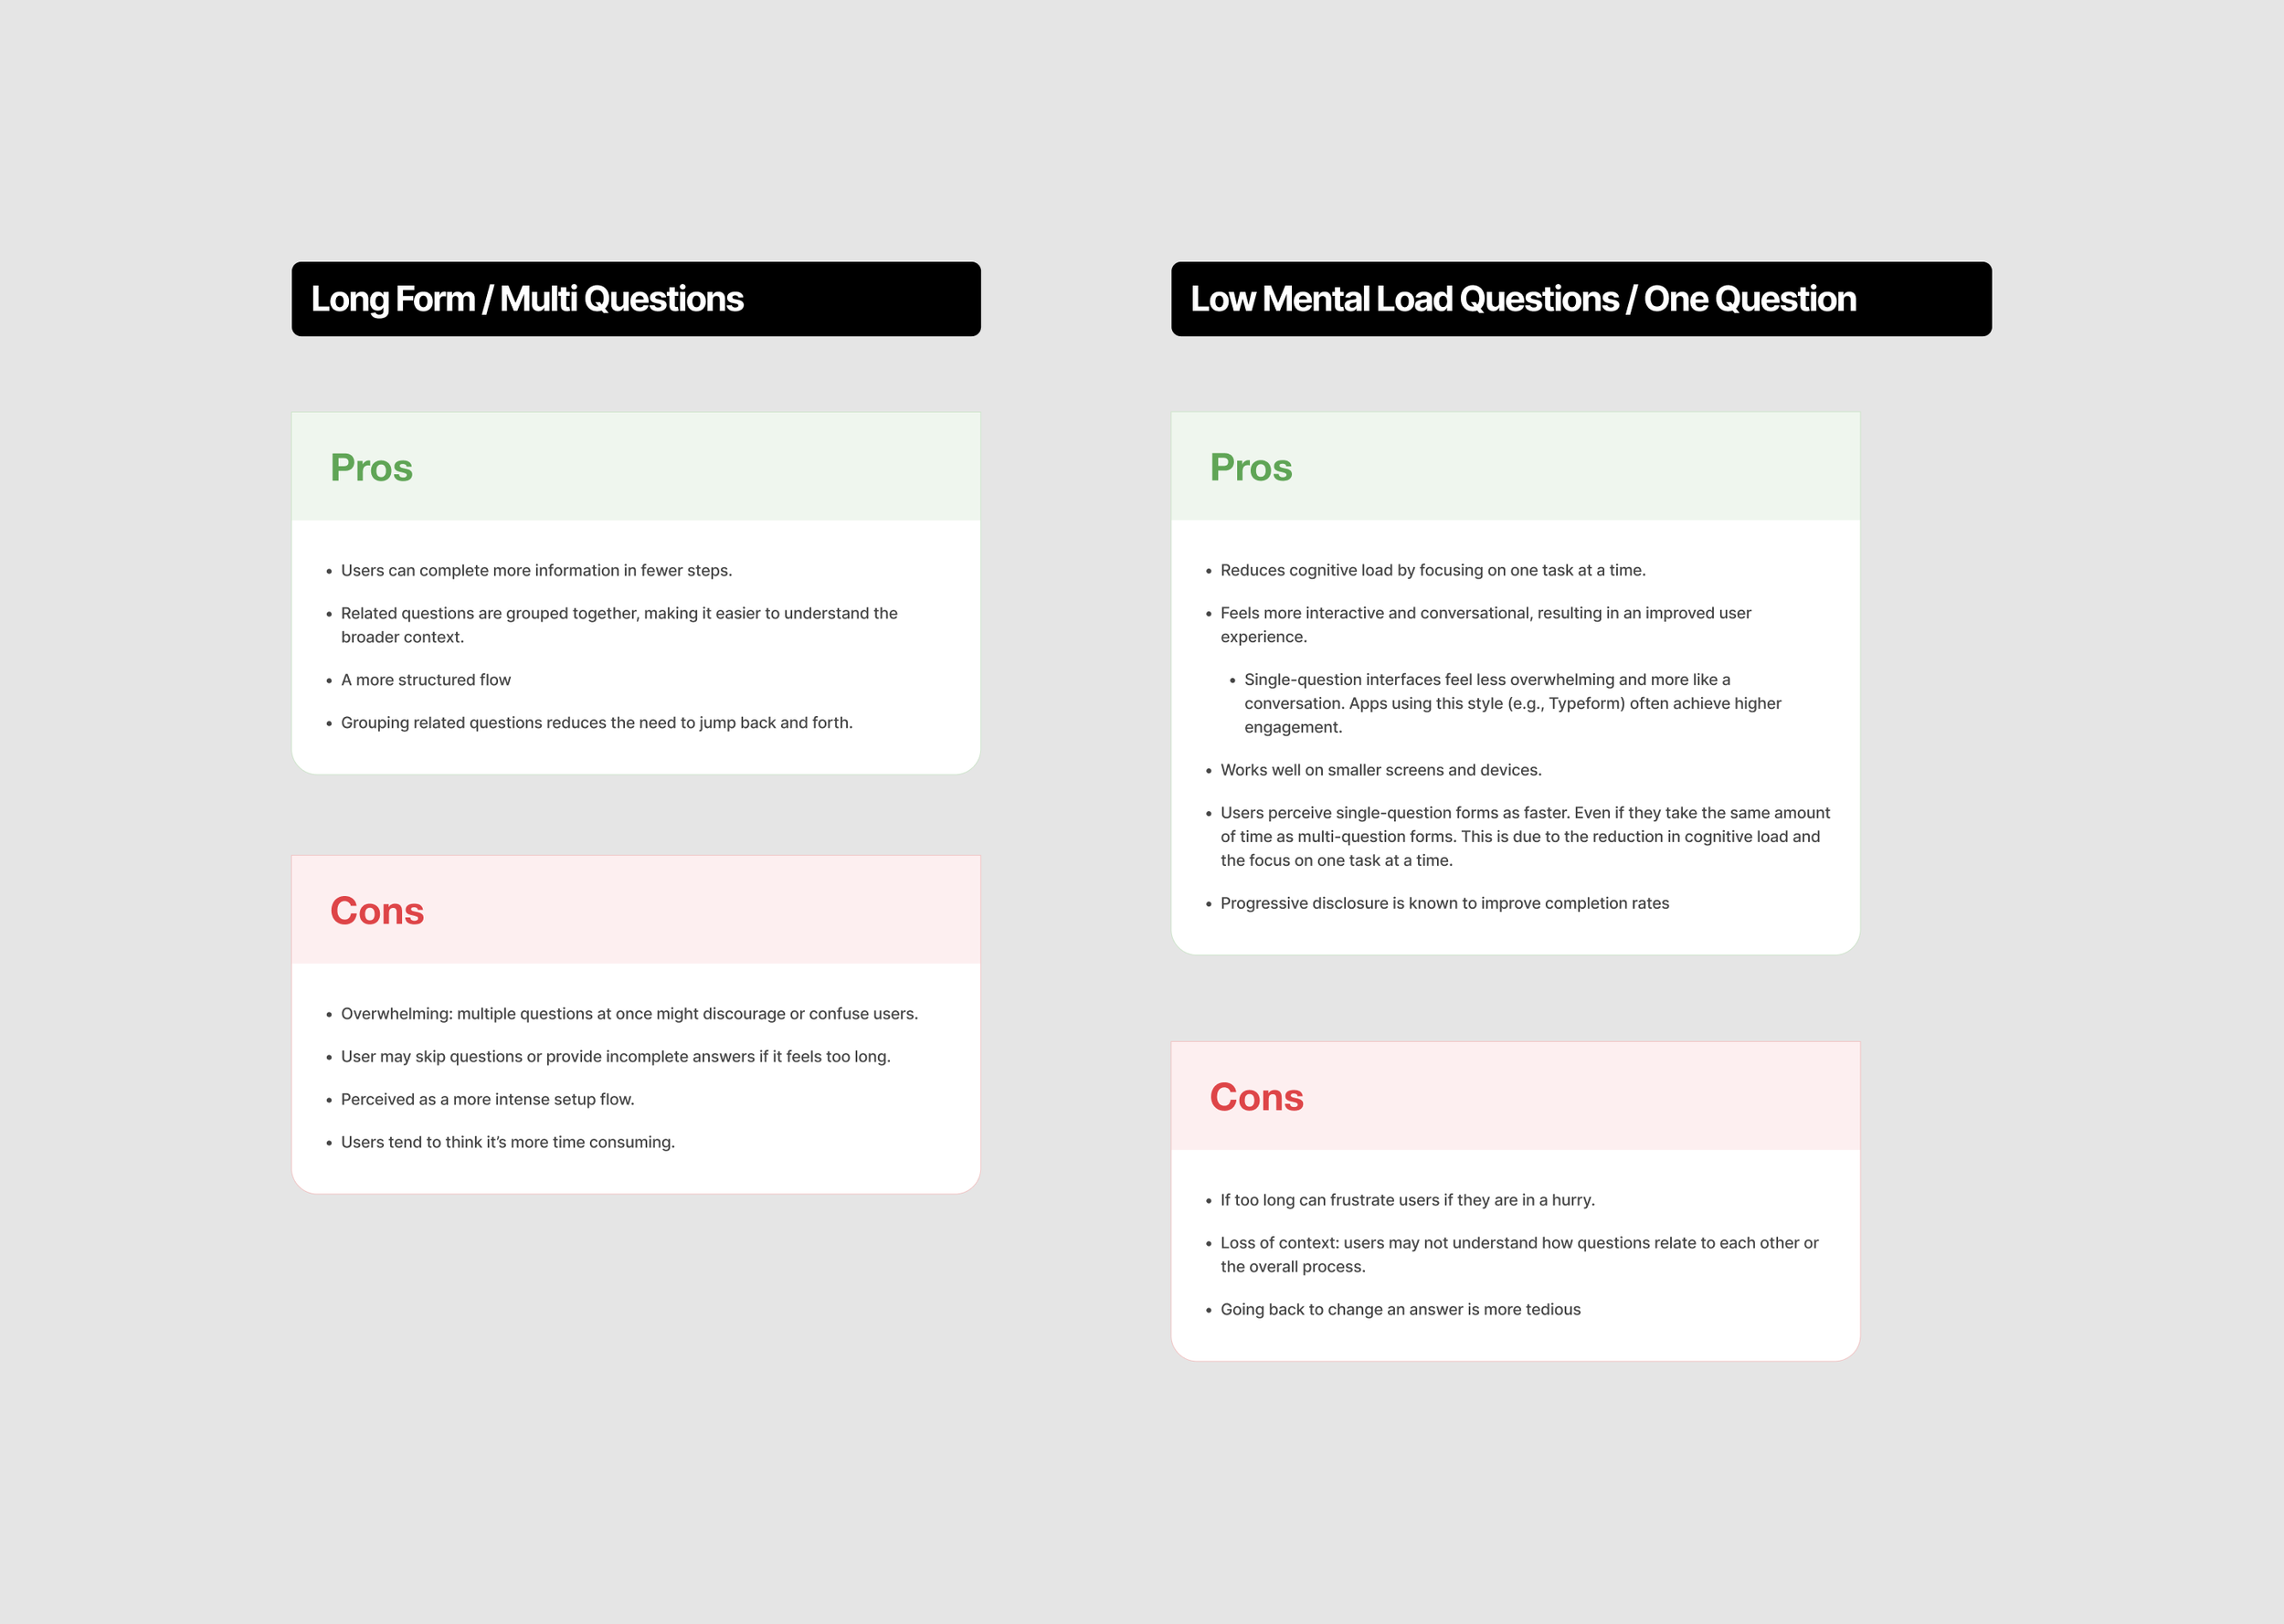
Question Styles - Pros & Cons
We reviewed the different question styles used across onboarding experiences and outlined the pros and cons of each approach. The single-question pattern could make setup feel less cognitively demanding and give users a stronger sense of progress, so rather than assuming it was the right direction, we decided to test it and let the results guide us.
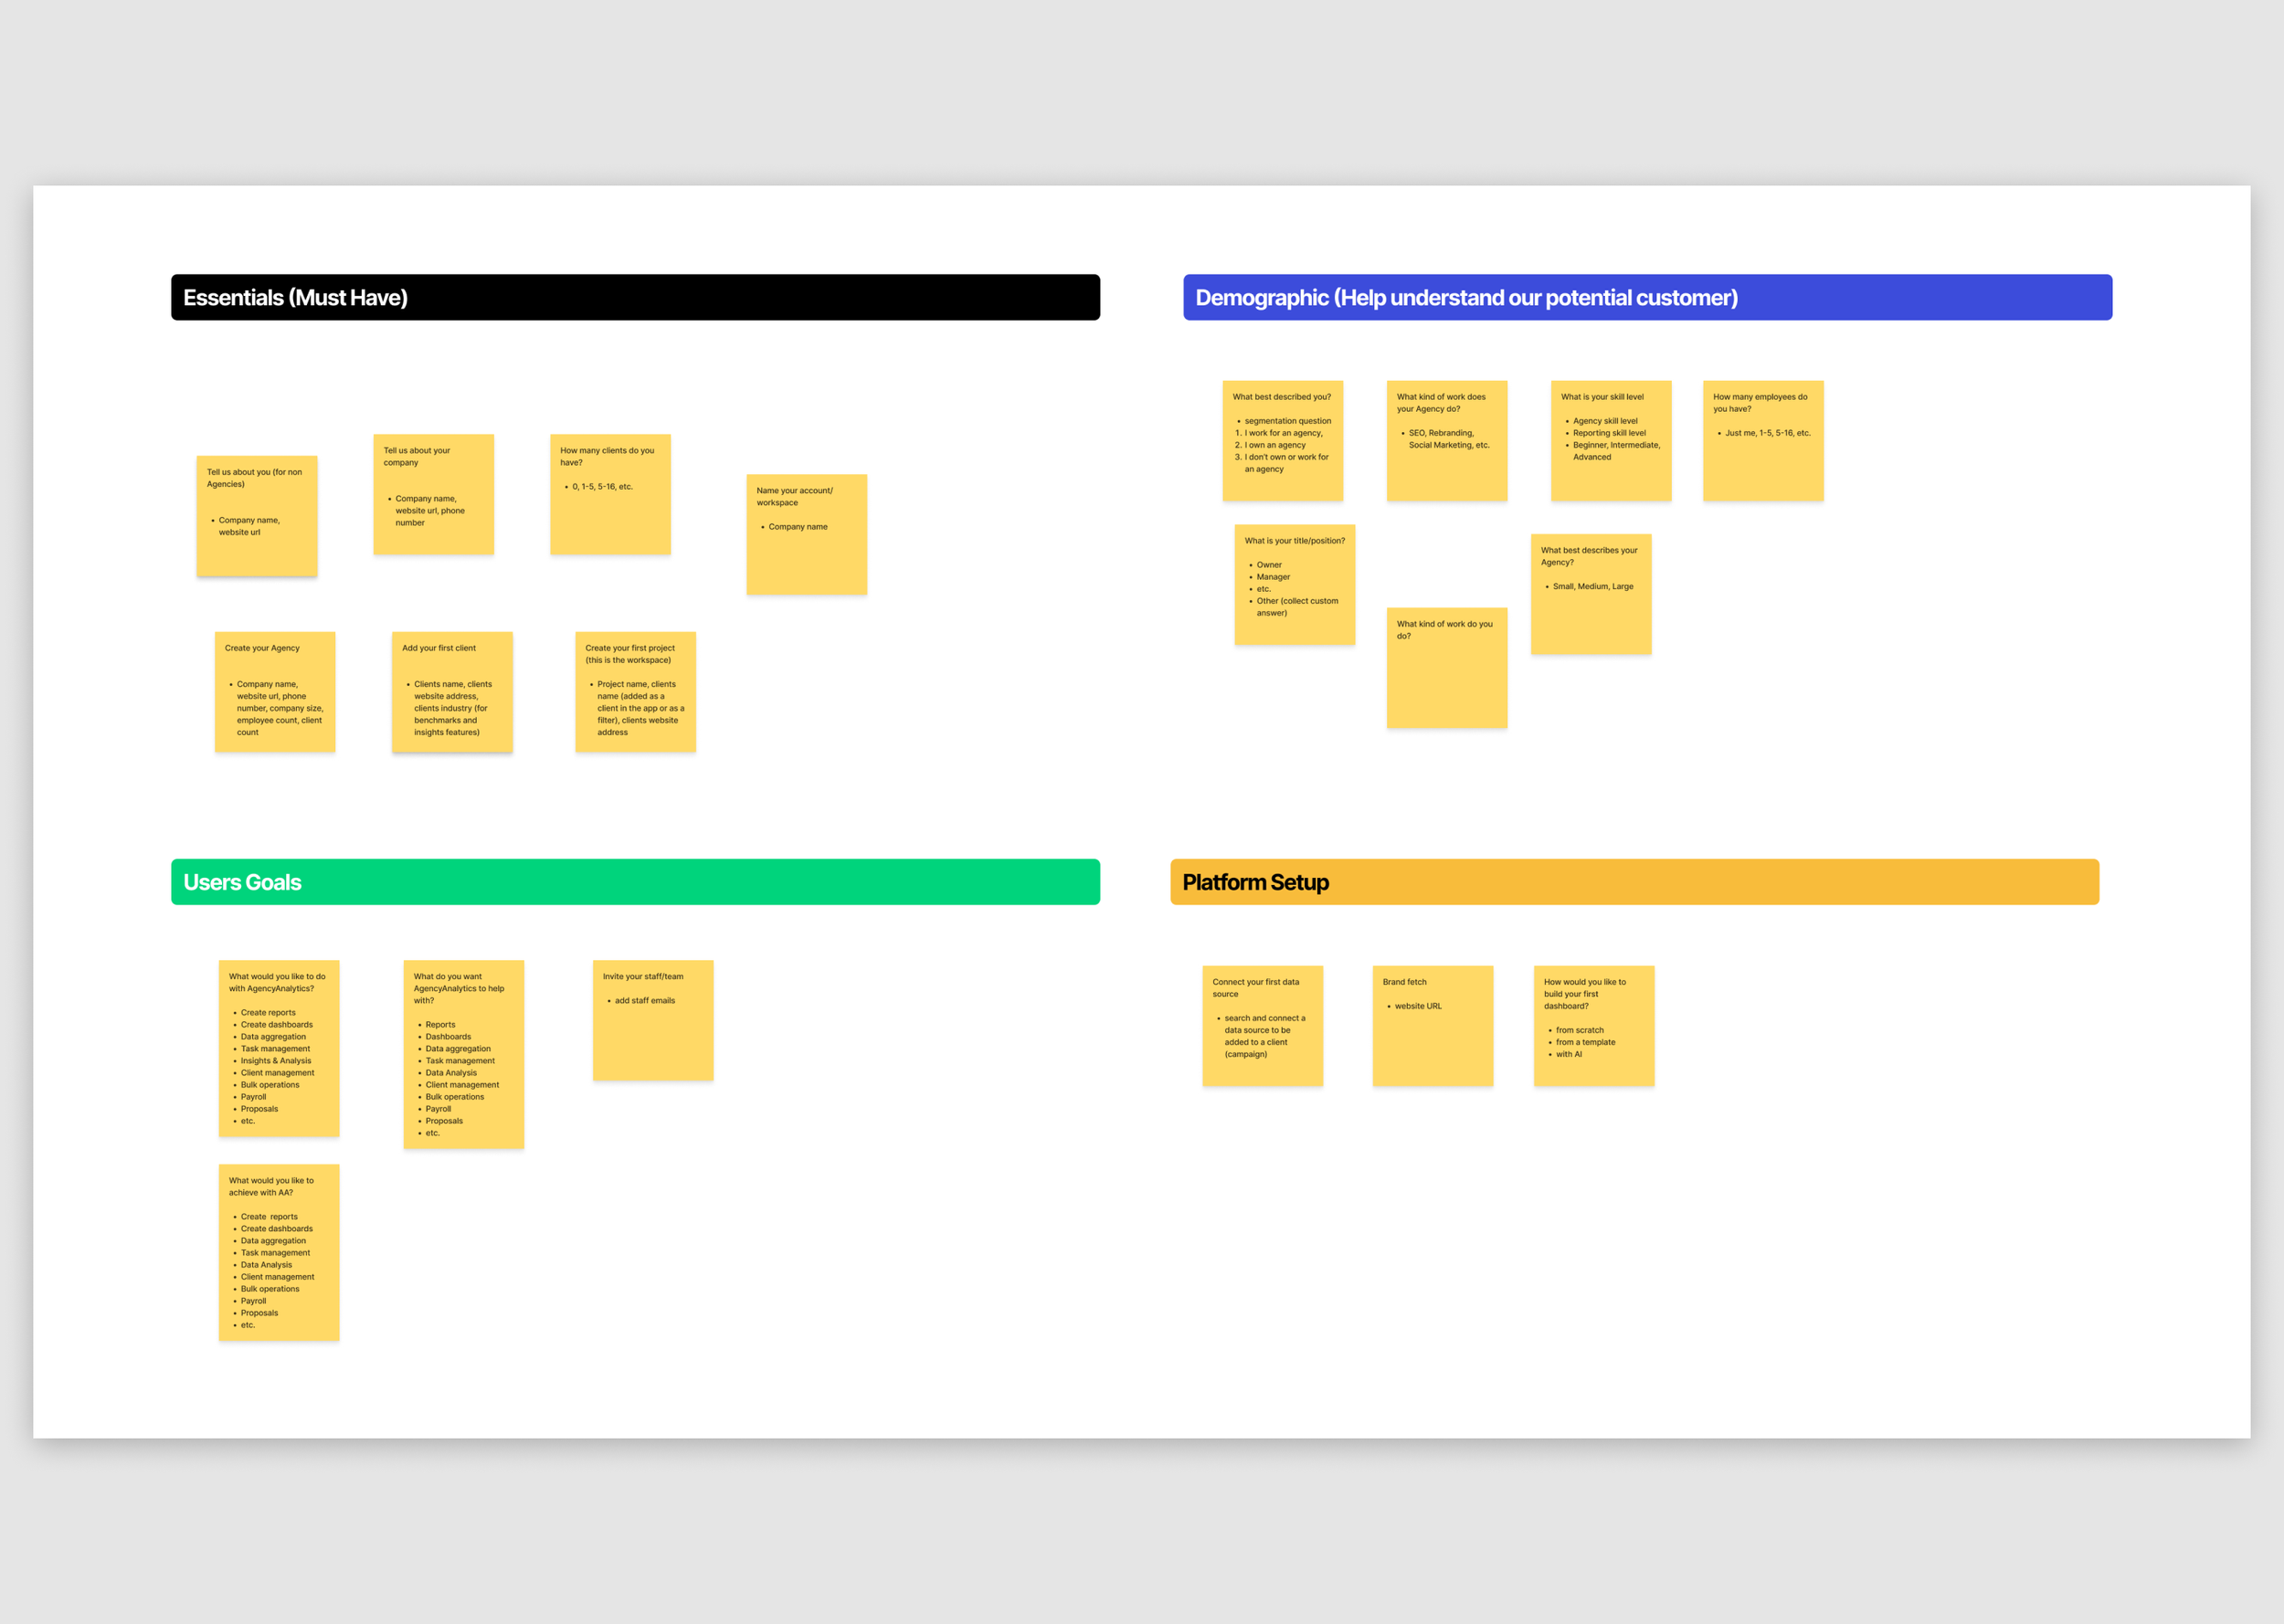
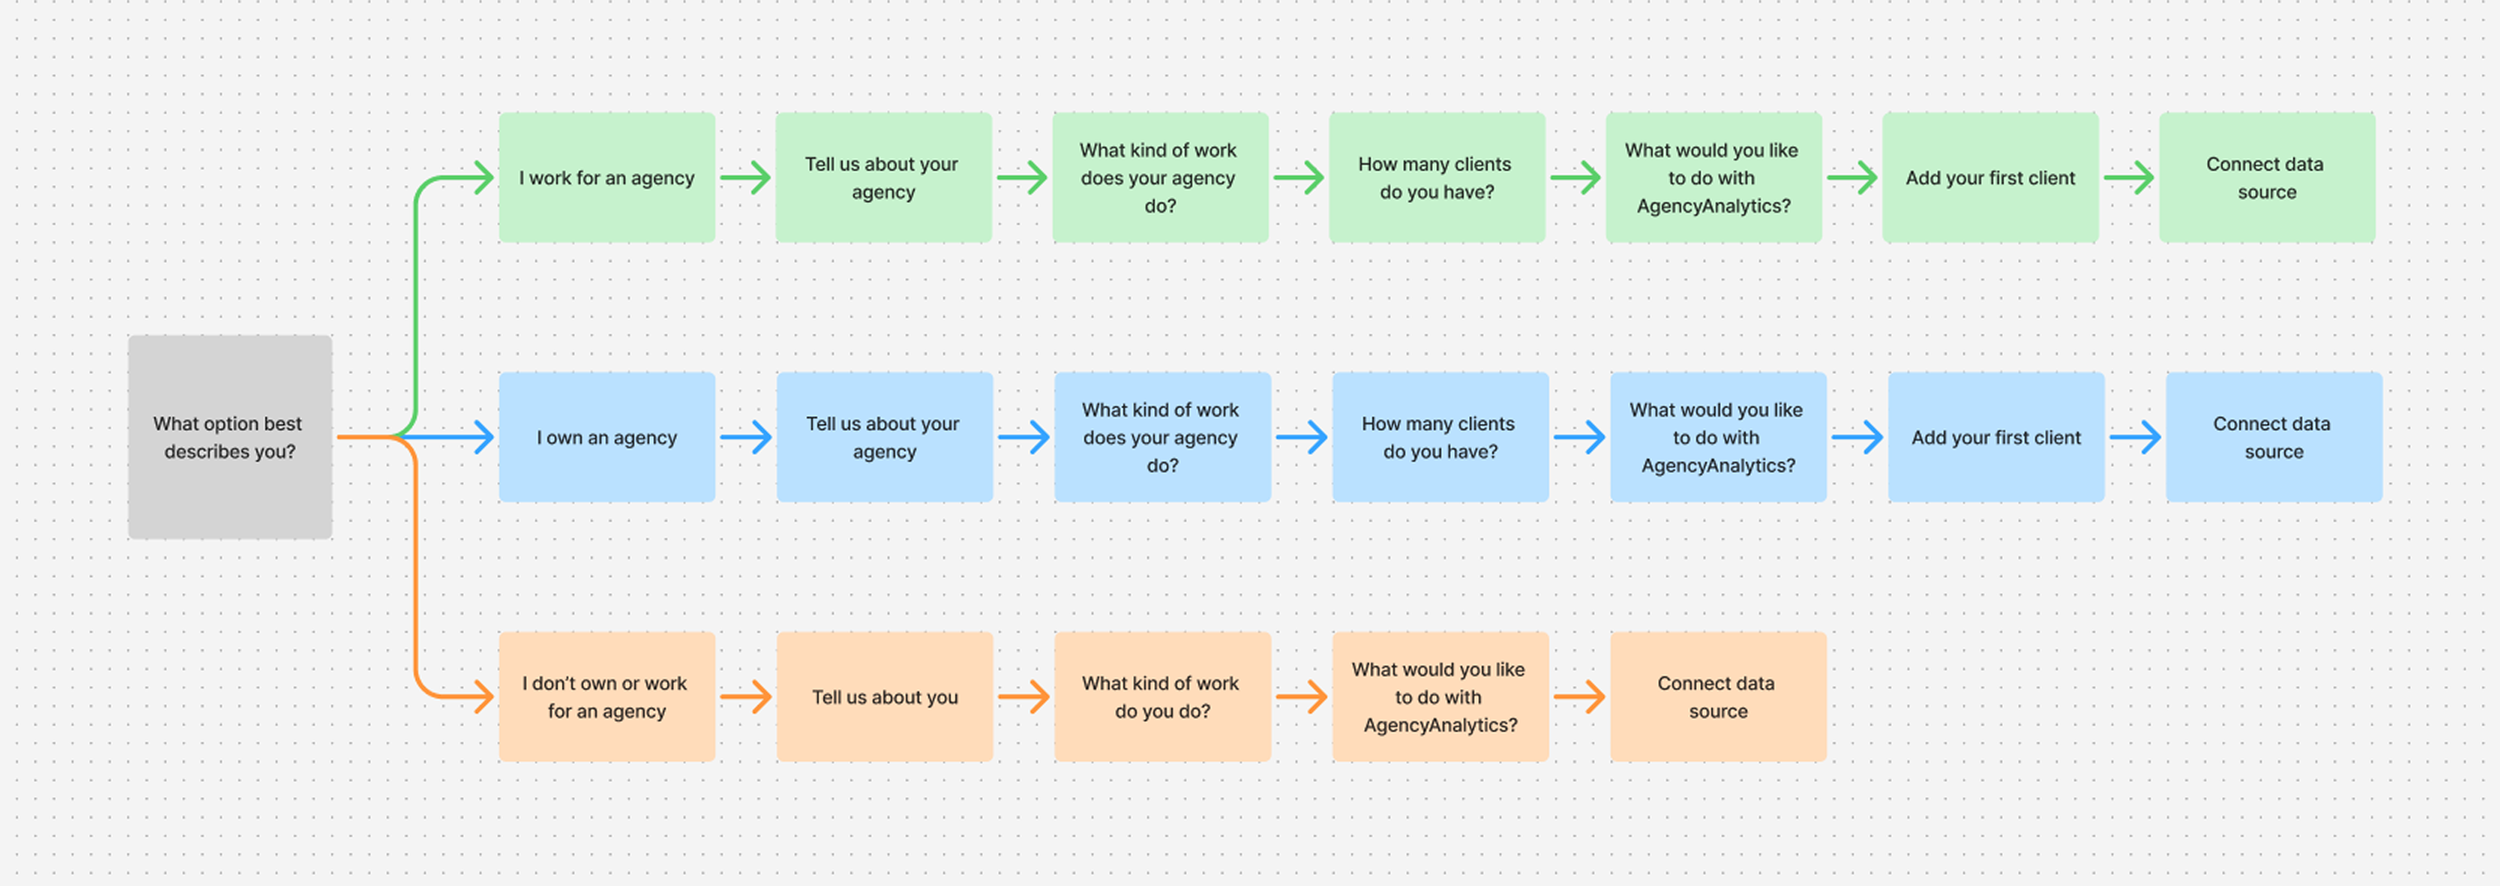
Mapping the Experience
I worked with teams across the company to understand what information we needed to collect, why we needed it, and where it made the most sense within the onboarding journey.
I mapped the onboarding flow to ensure each question had a clear purpose and that the experience felt natural for a new user.
This helped us balance business needs, data collection, and the user's desire to get into the product quickly.
Design
Wireframes
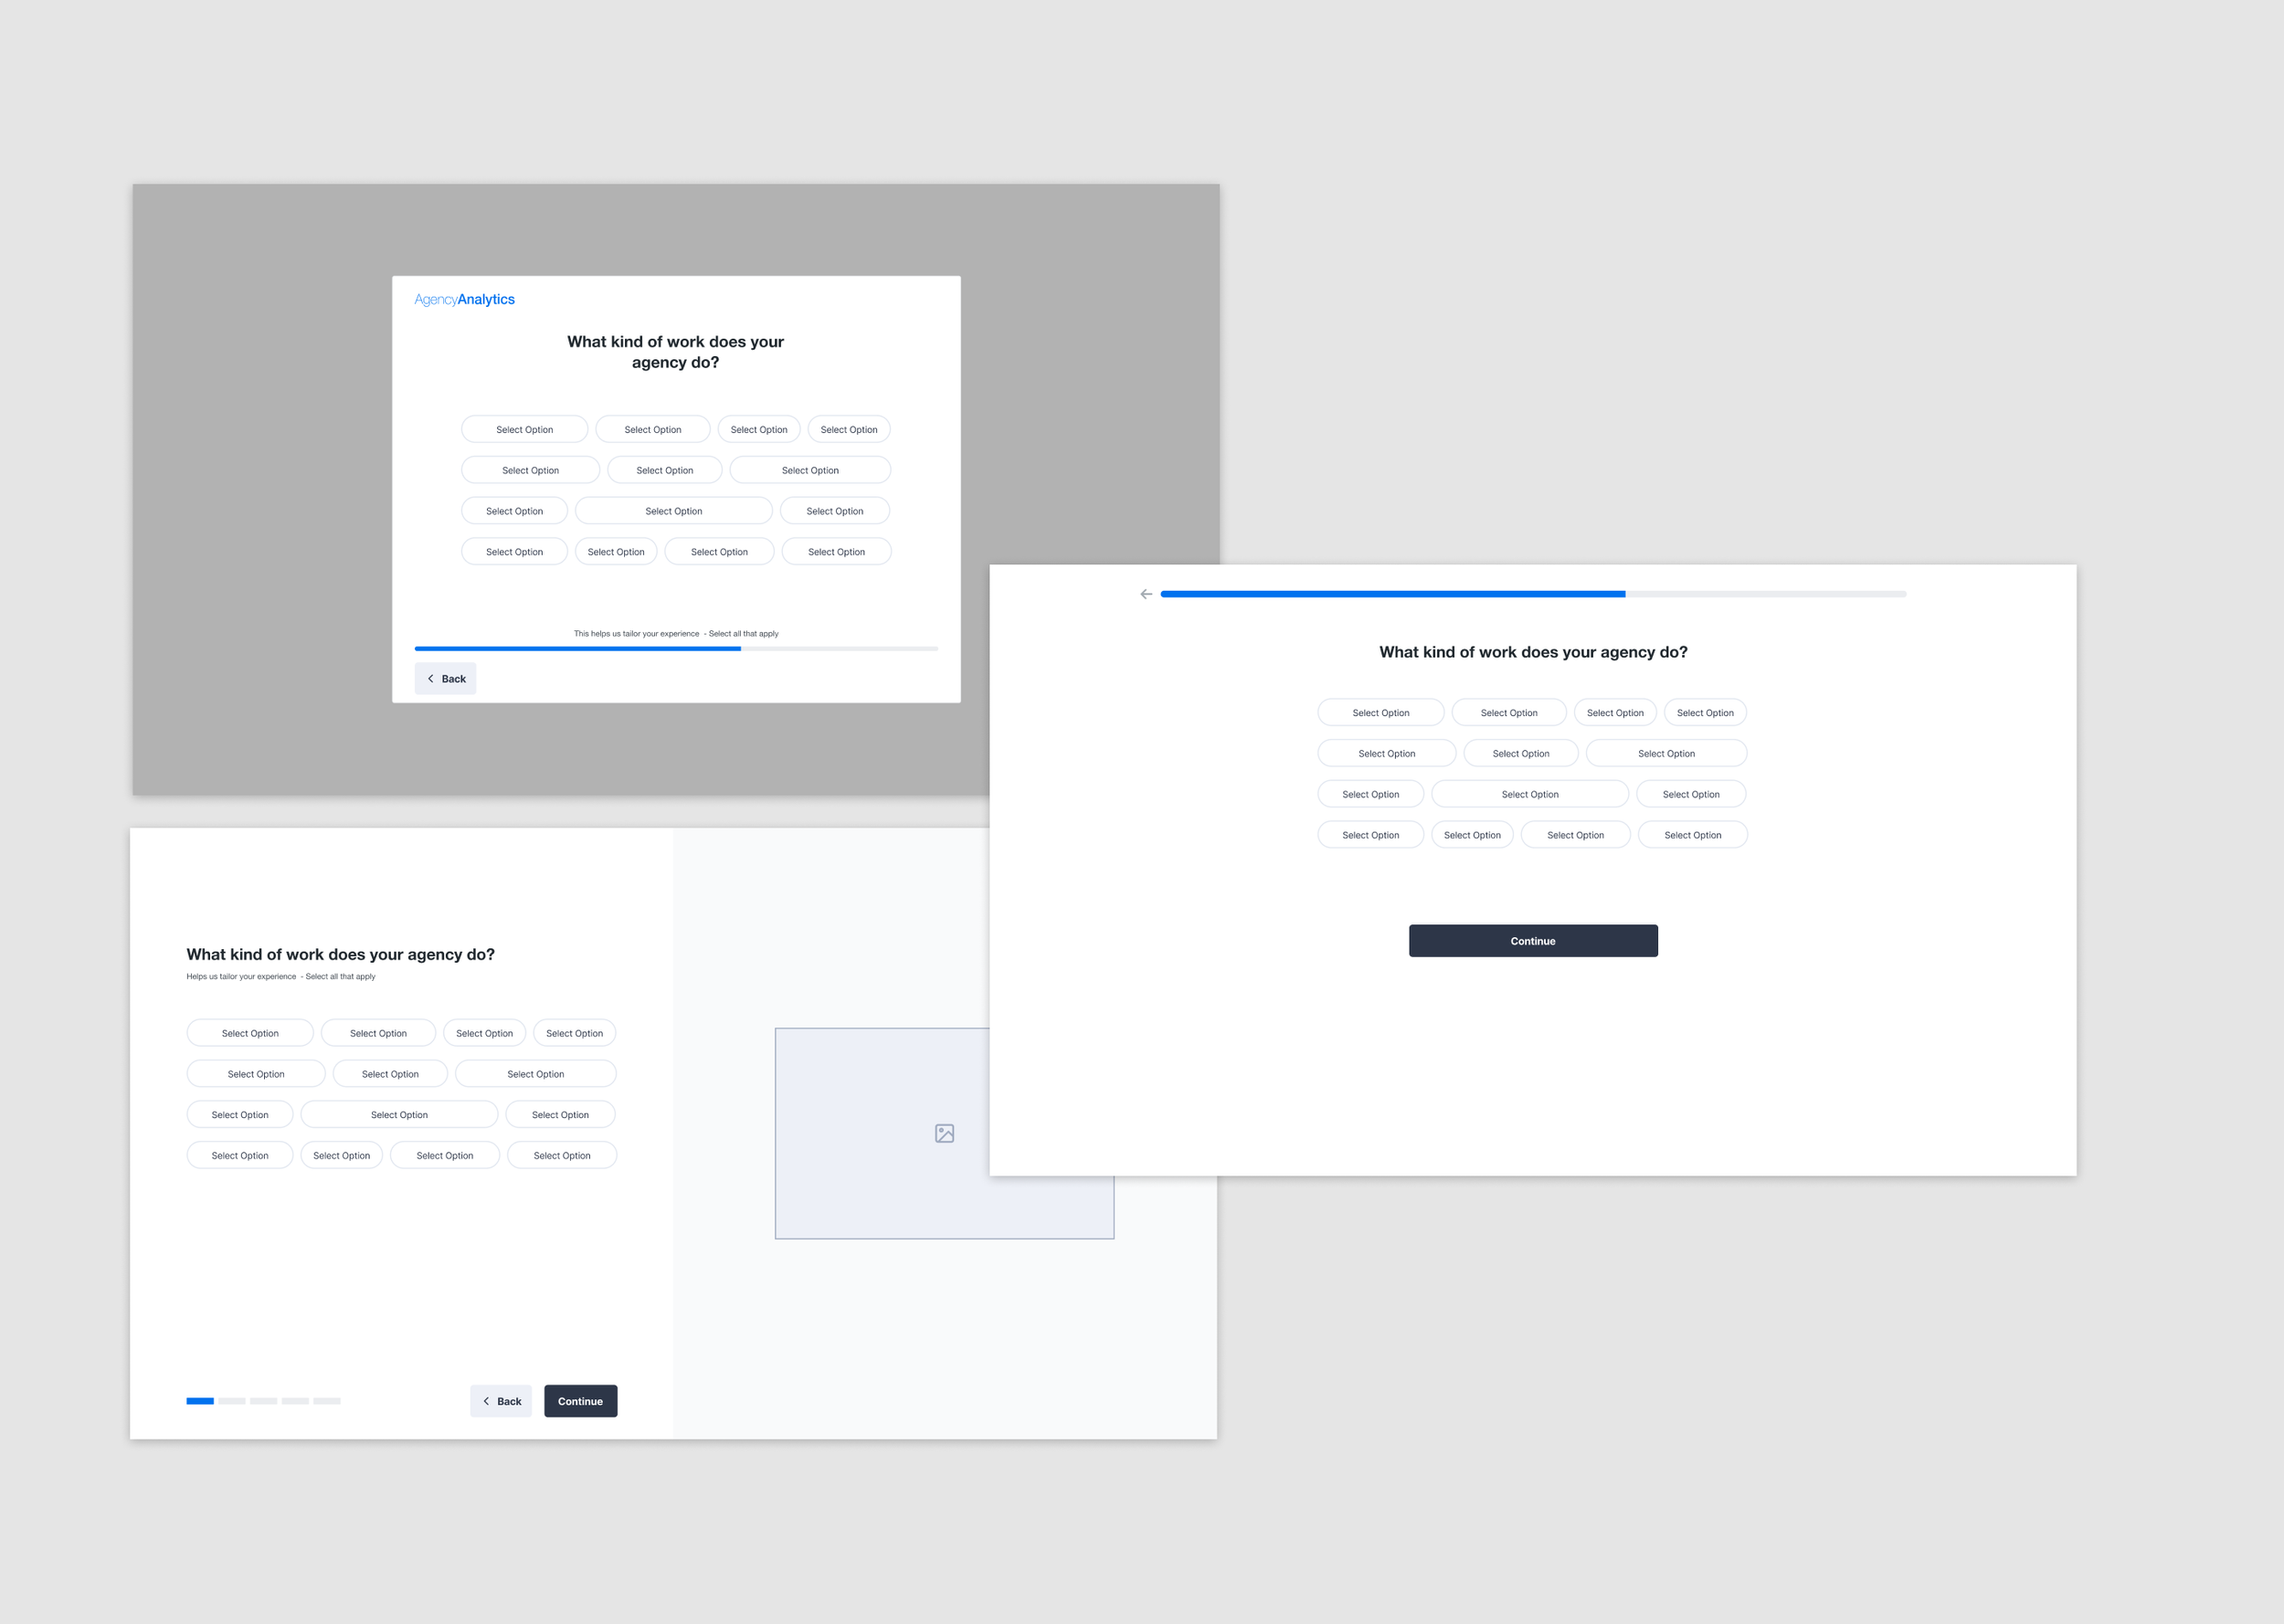
I quickly created low-fidelity wireframes exploring three different layout styles to the onboarding experience.
I highlighted the pros and cons of each direction and used design reviews with stakeholders to discuss the trade-offs.
We agreed to test the modal style.
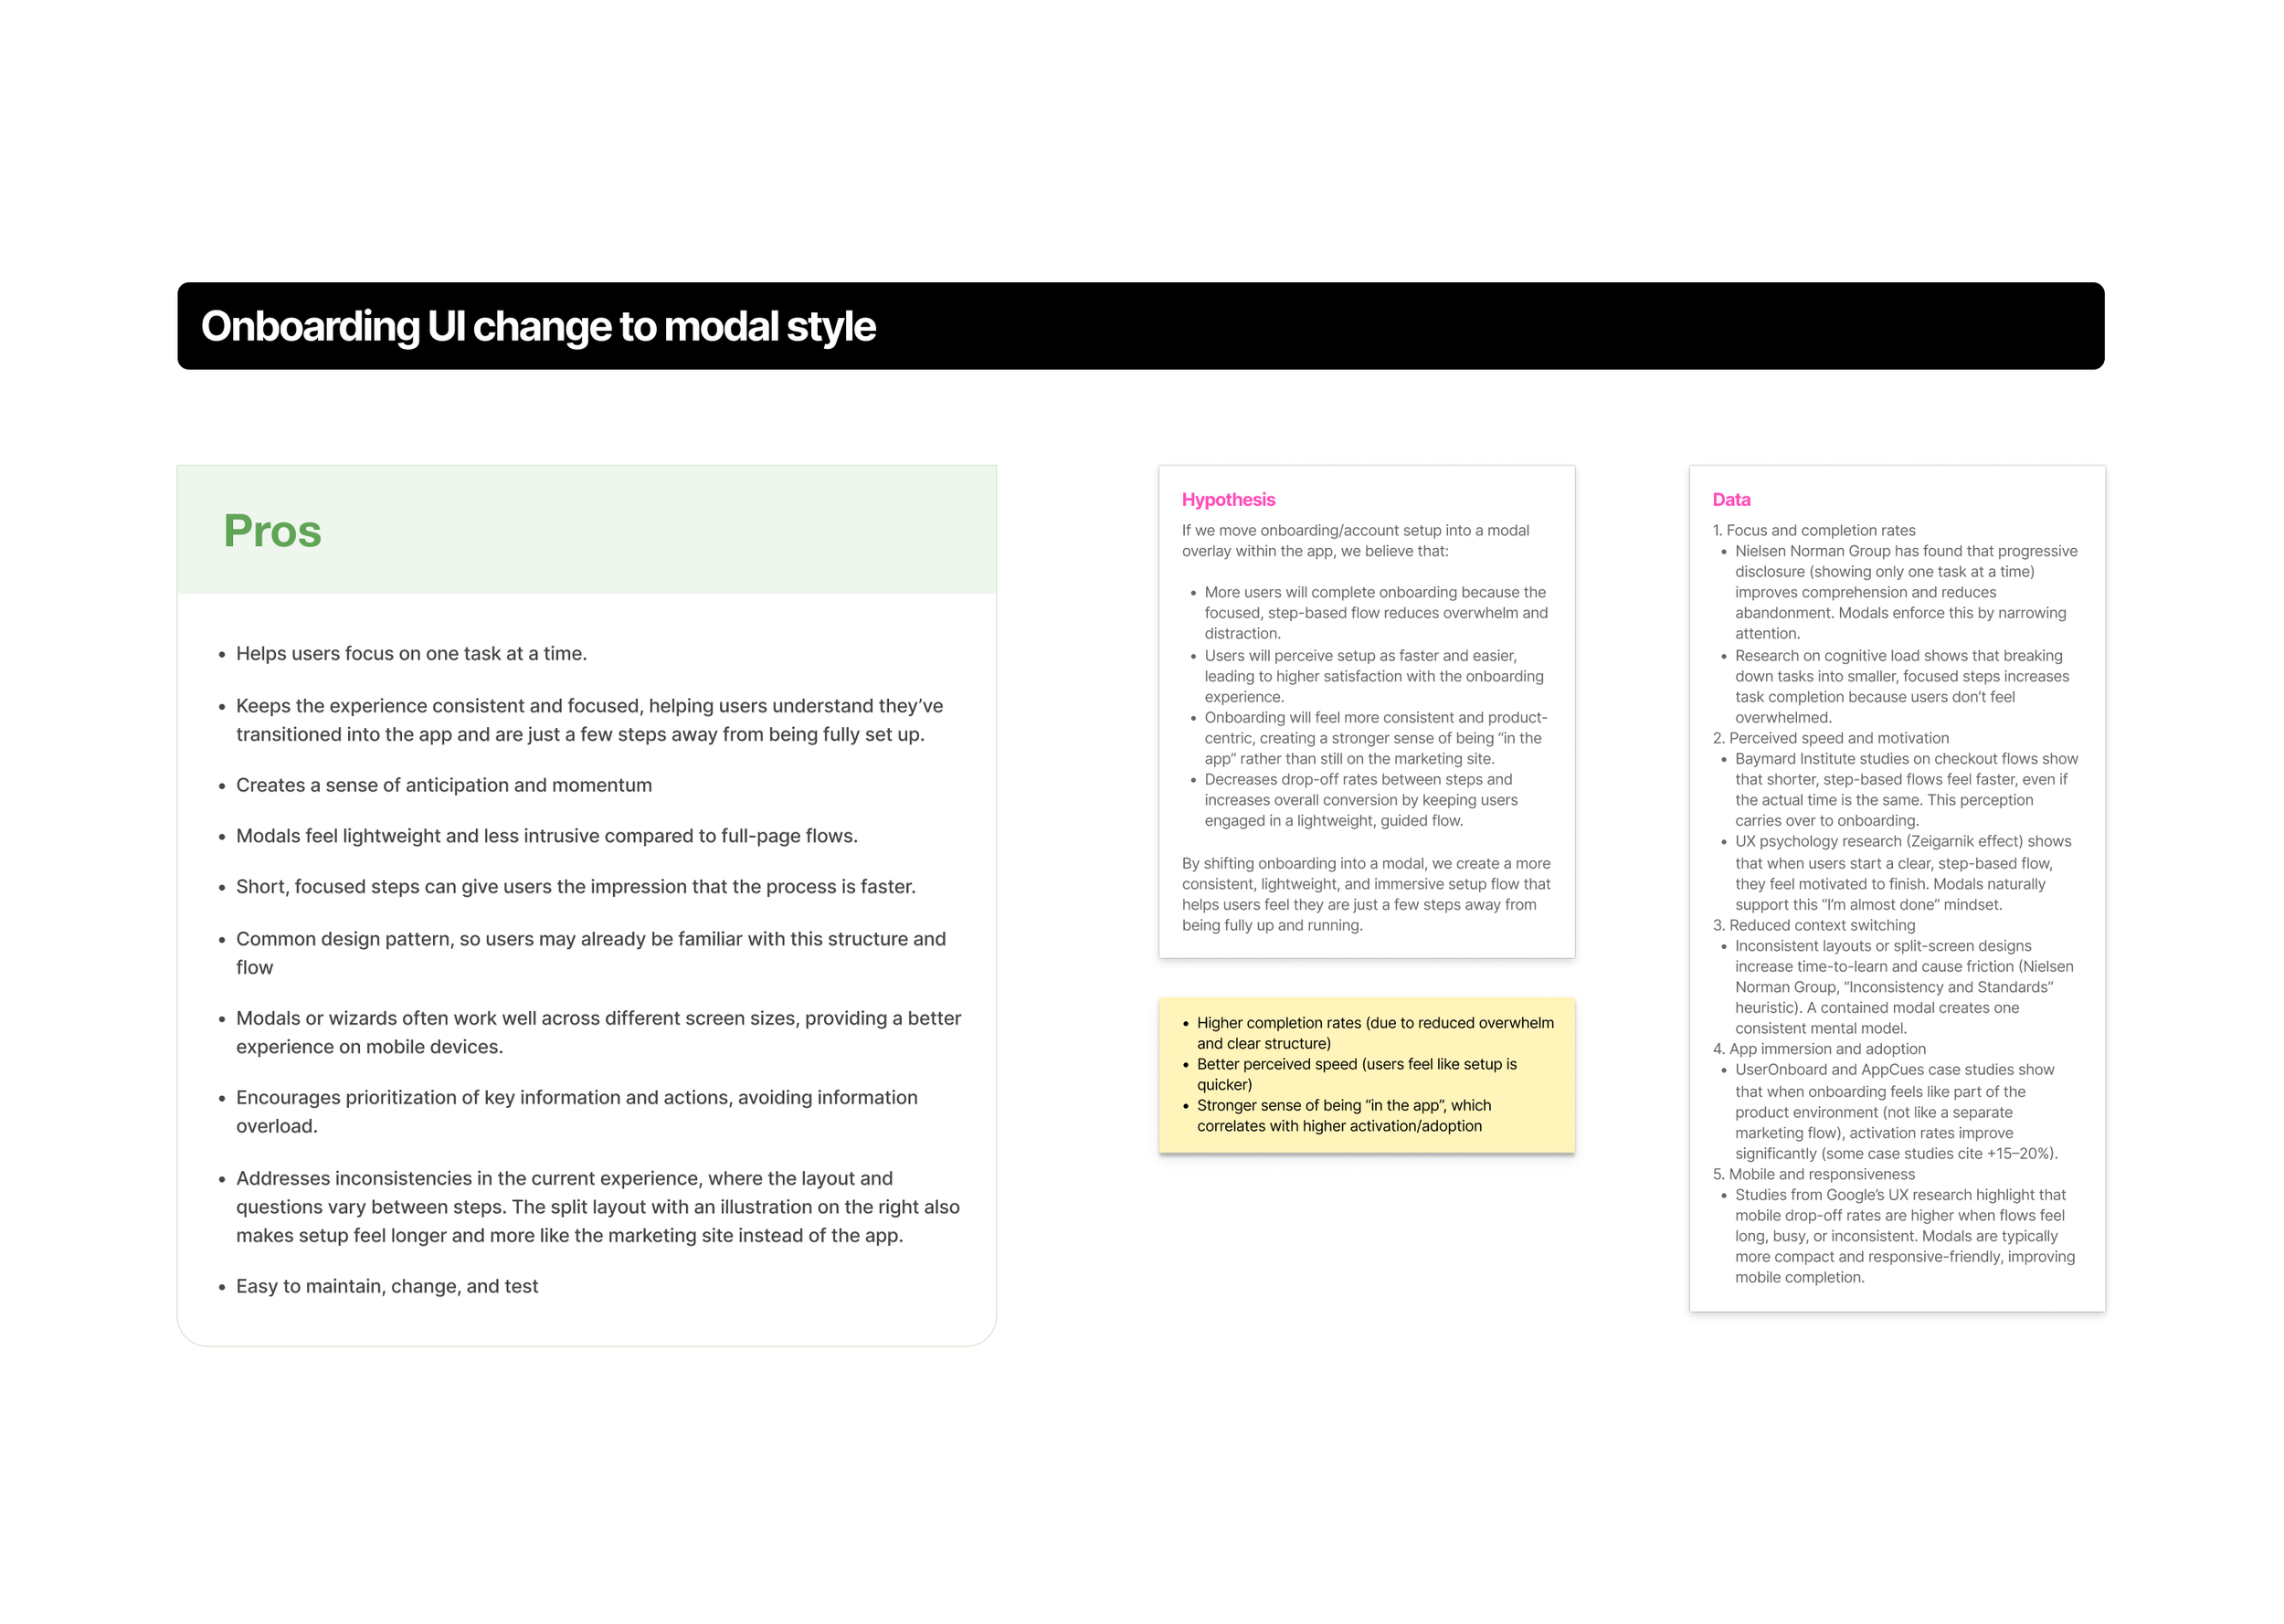
Modal Style - Rationale
We believed combining the modal and single-question approaches could make onboarding feel more focused and manageable.
One task at a time reduces distractions and makes setup feel less overwhelming
Short, focused steps create a stronger sense of progress and momentum
The modal helps onboarding feel like part of the app rather than an extension of the marketing site
A unified structure addresses inconsistencies across the existing onboarding experience
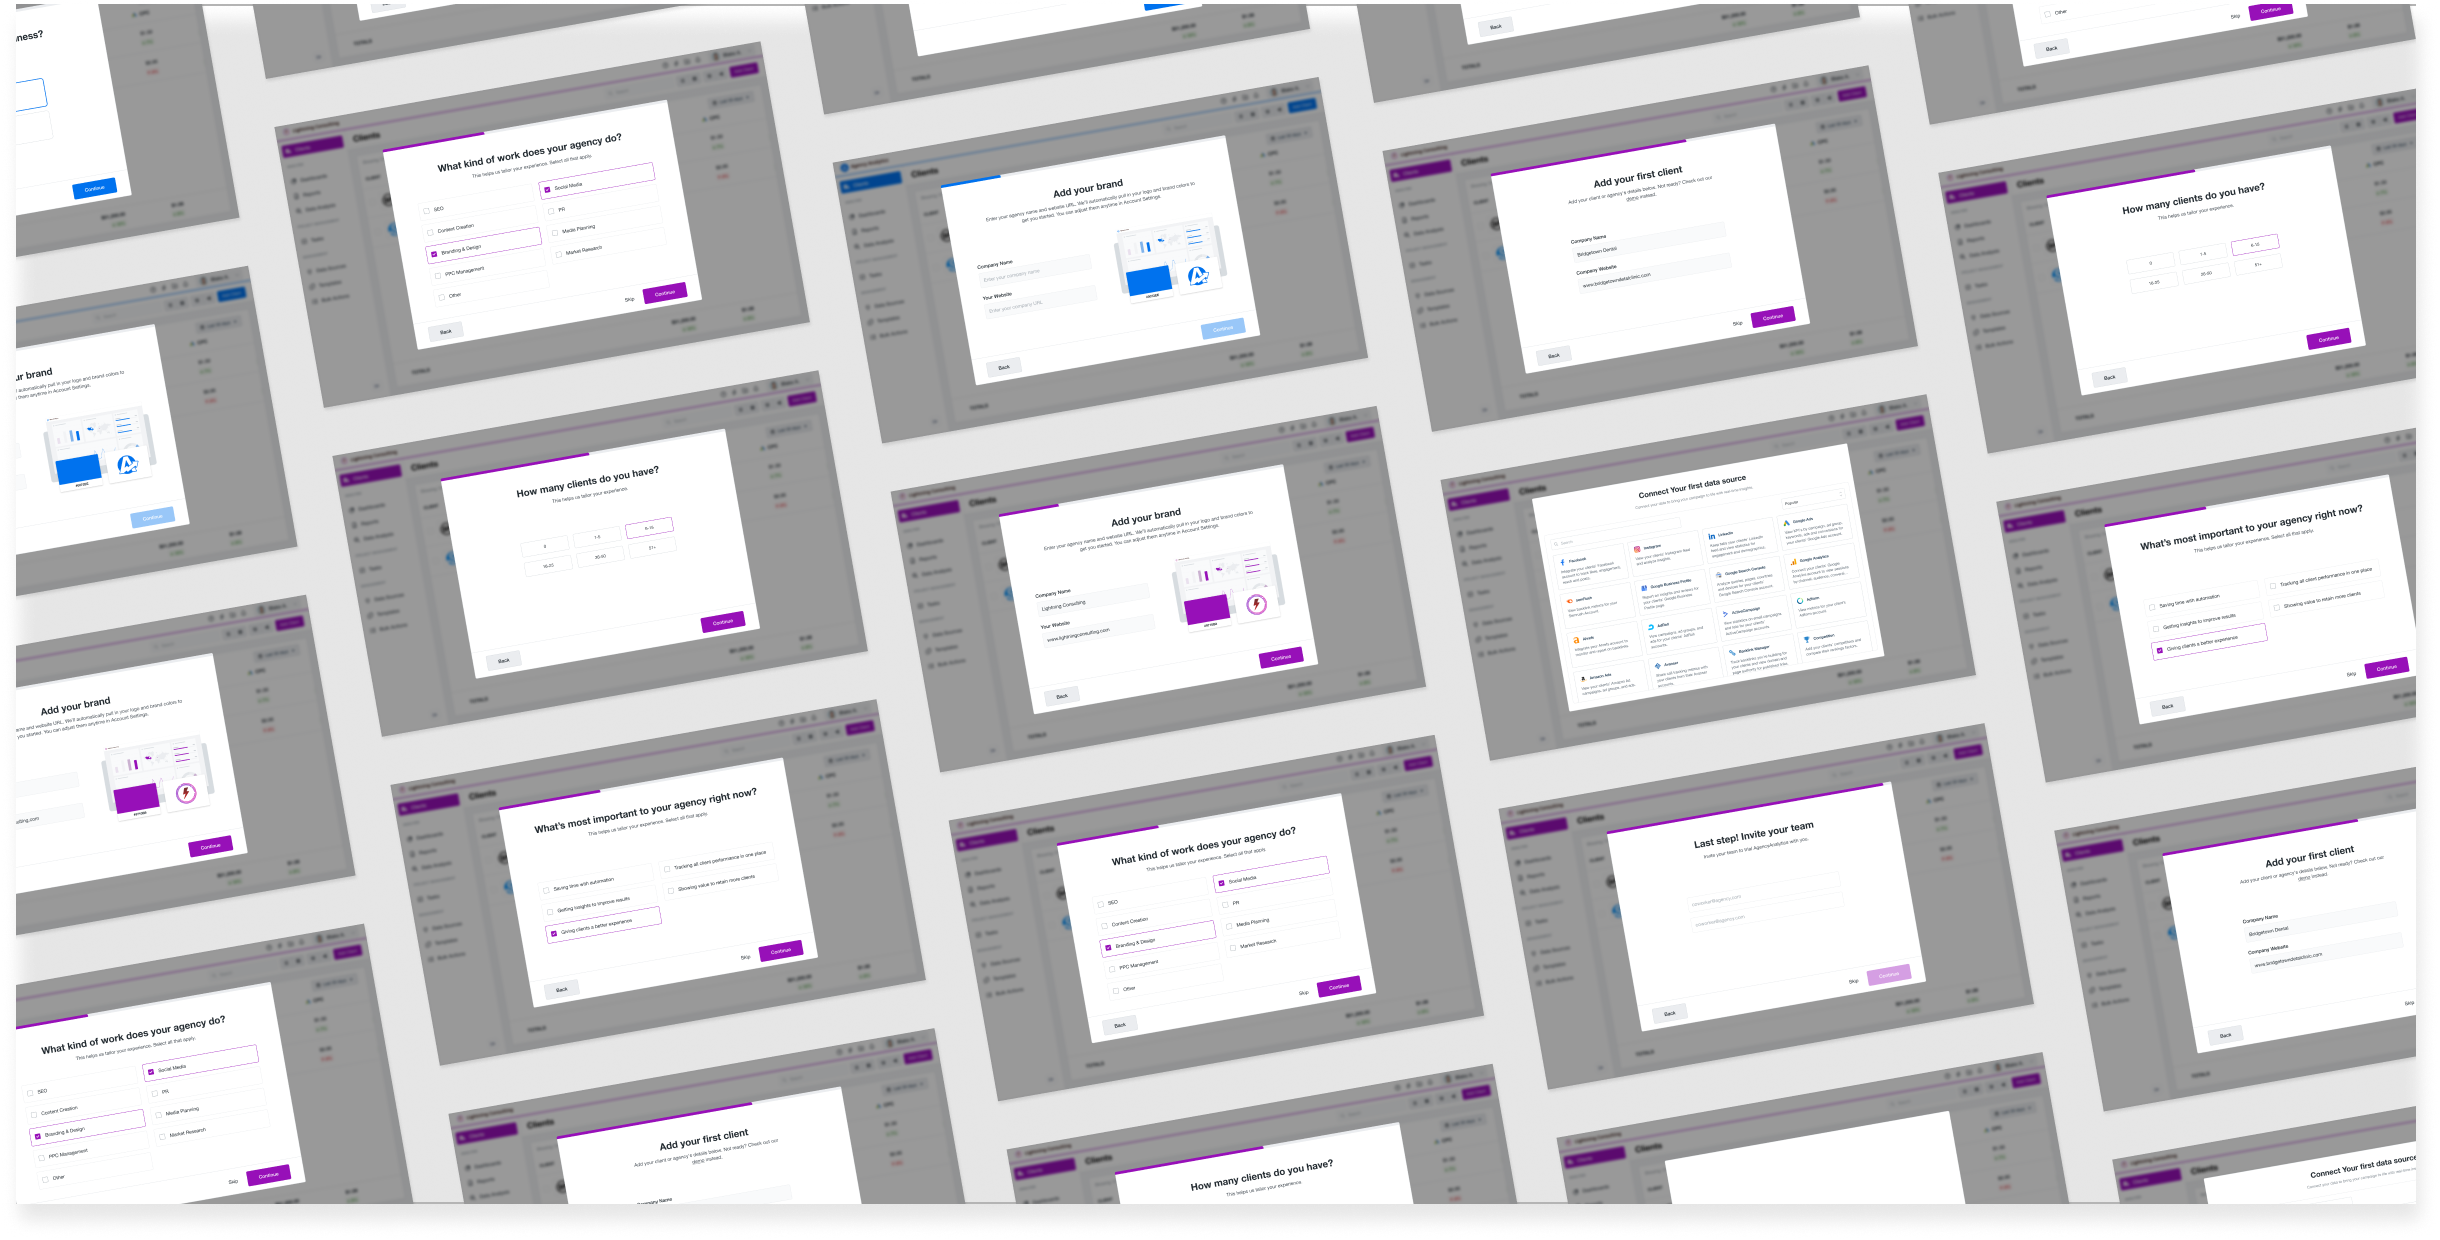
A few of the changes
Here are a few of the experiments we ran. Each experiment had a clear hypothesis, documentation, and tracking to measure its impact.
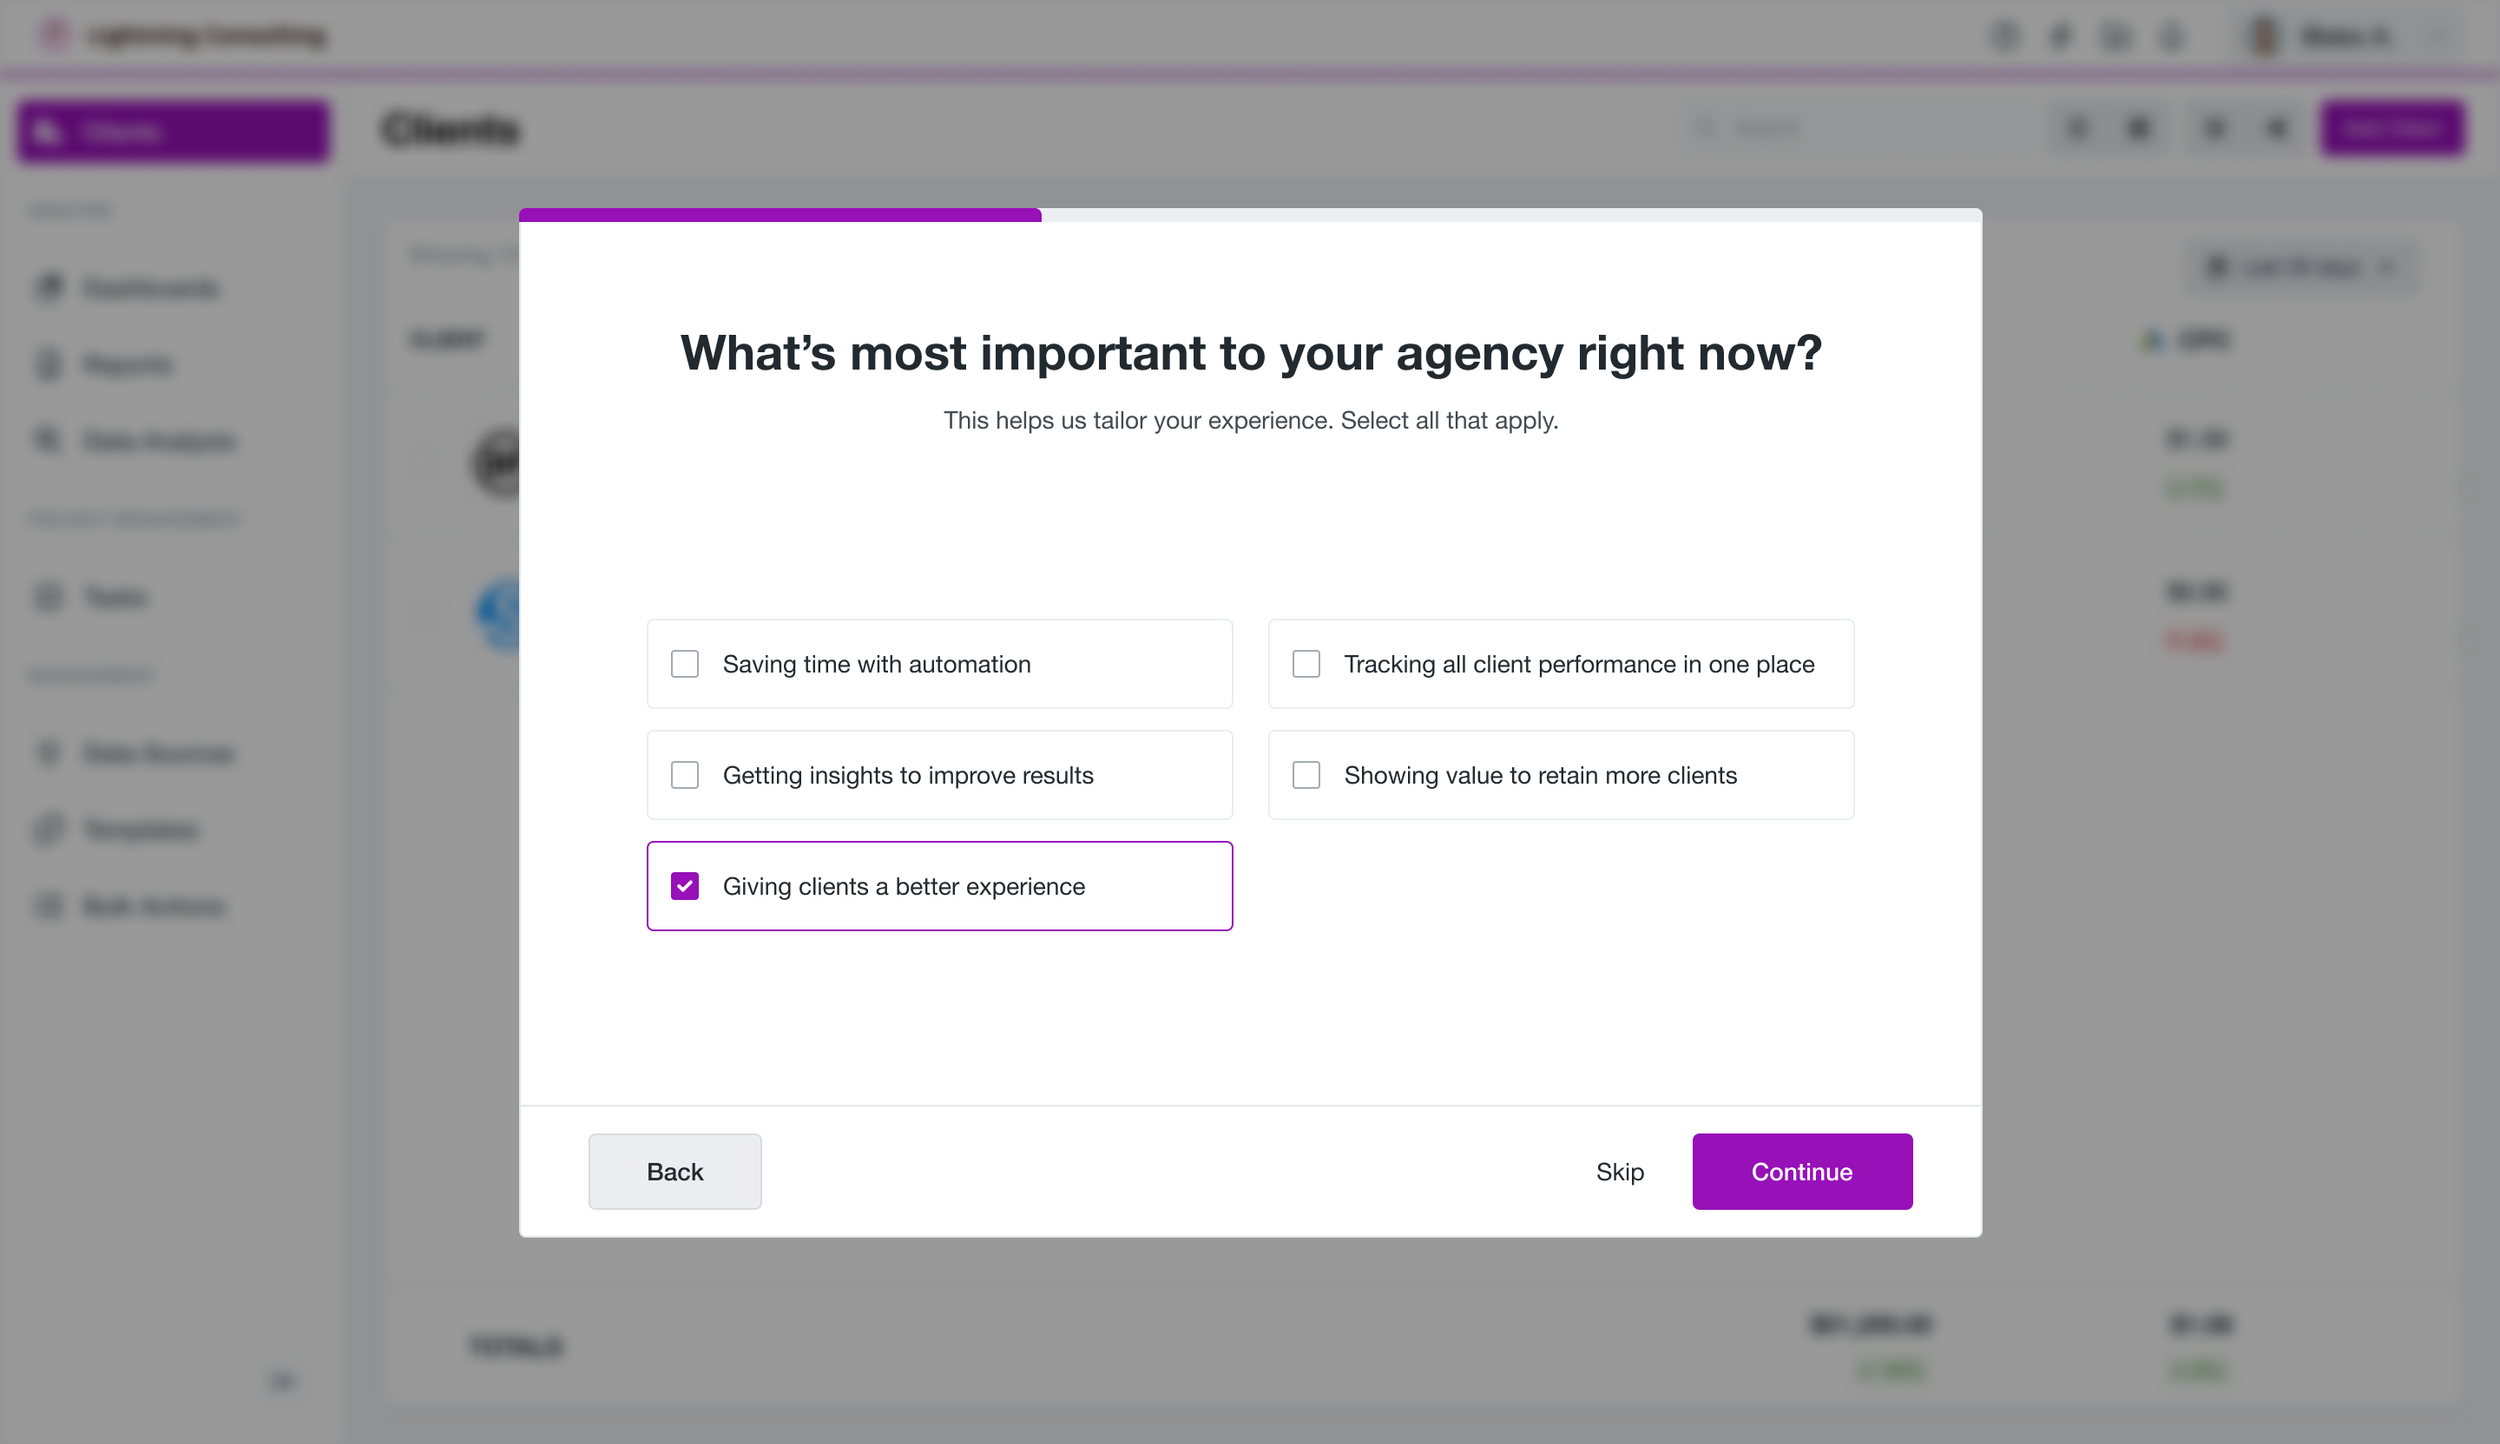
Understand Their Intent
Capture what users hope to accomplish with AgencyAnalytics so we can better understand their goals and tailor the onboarding experience.
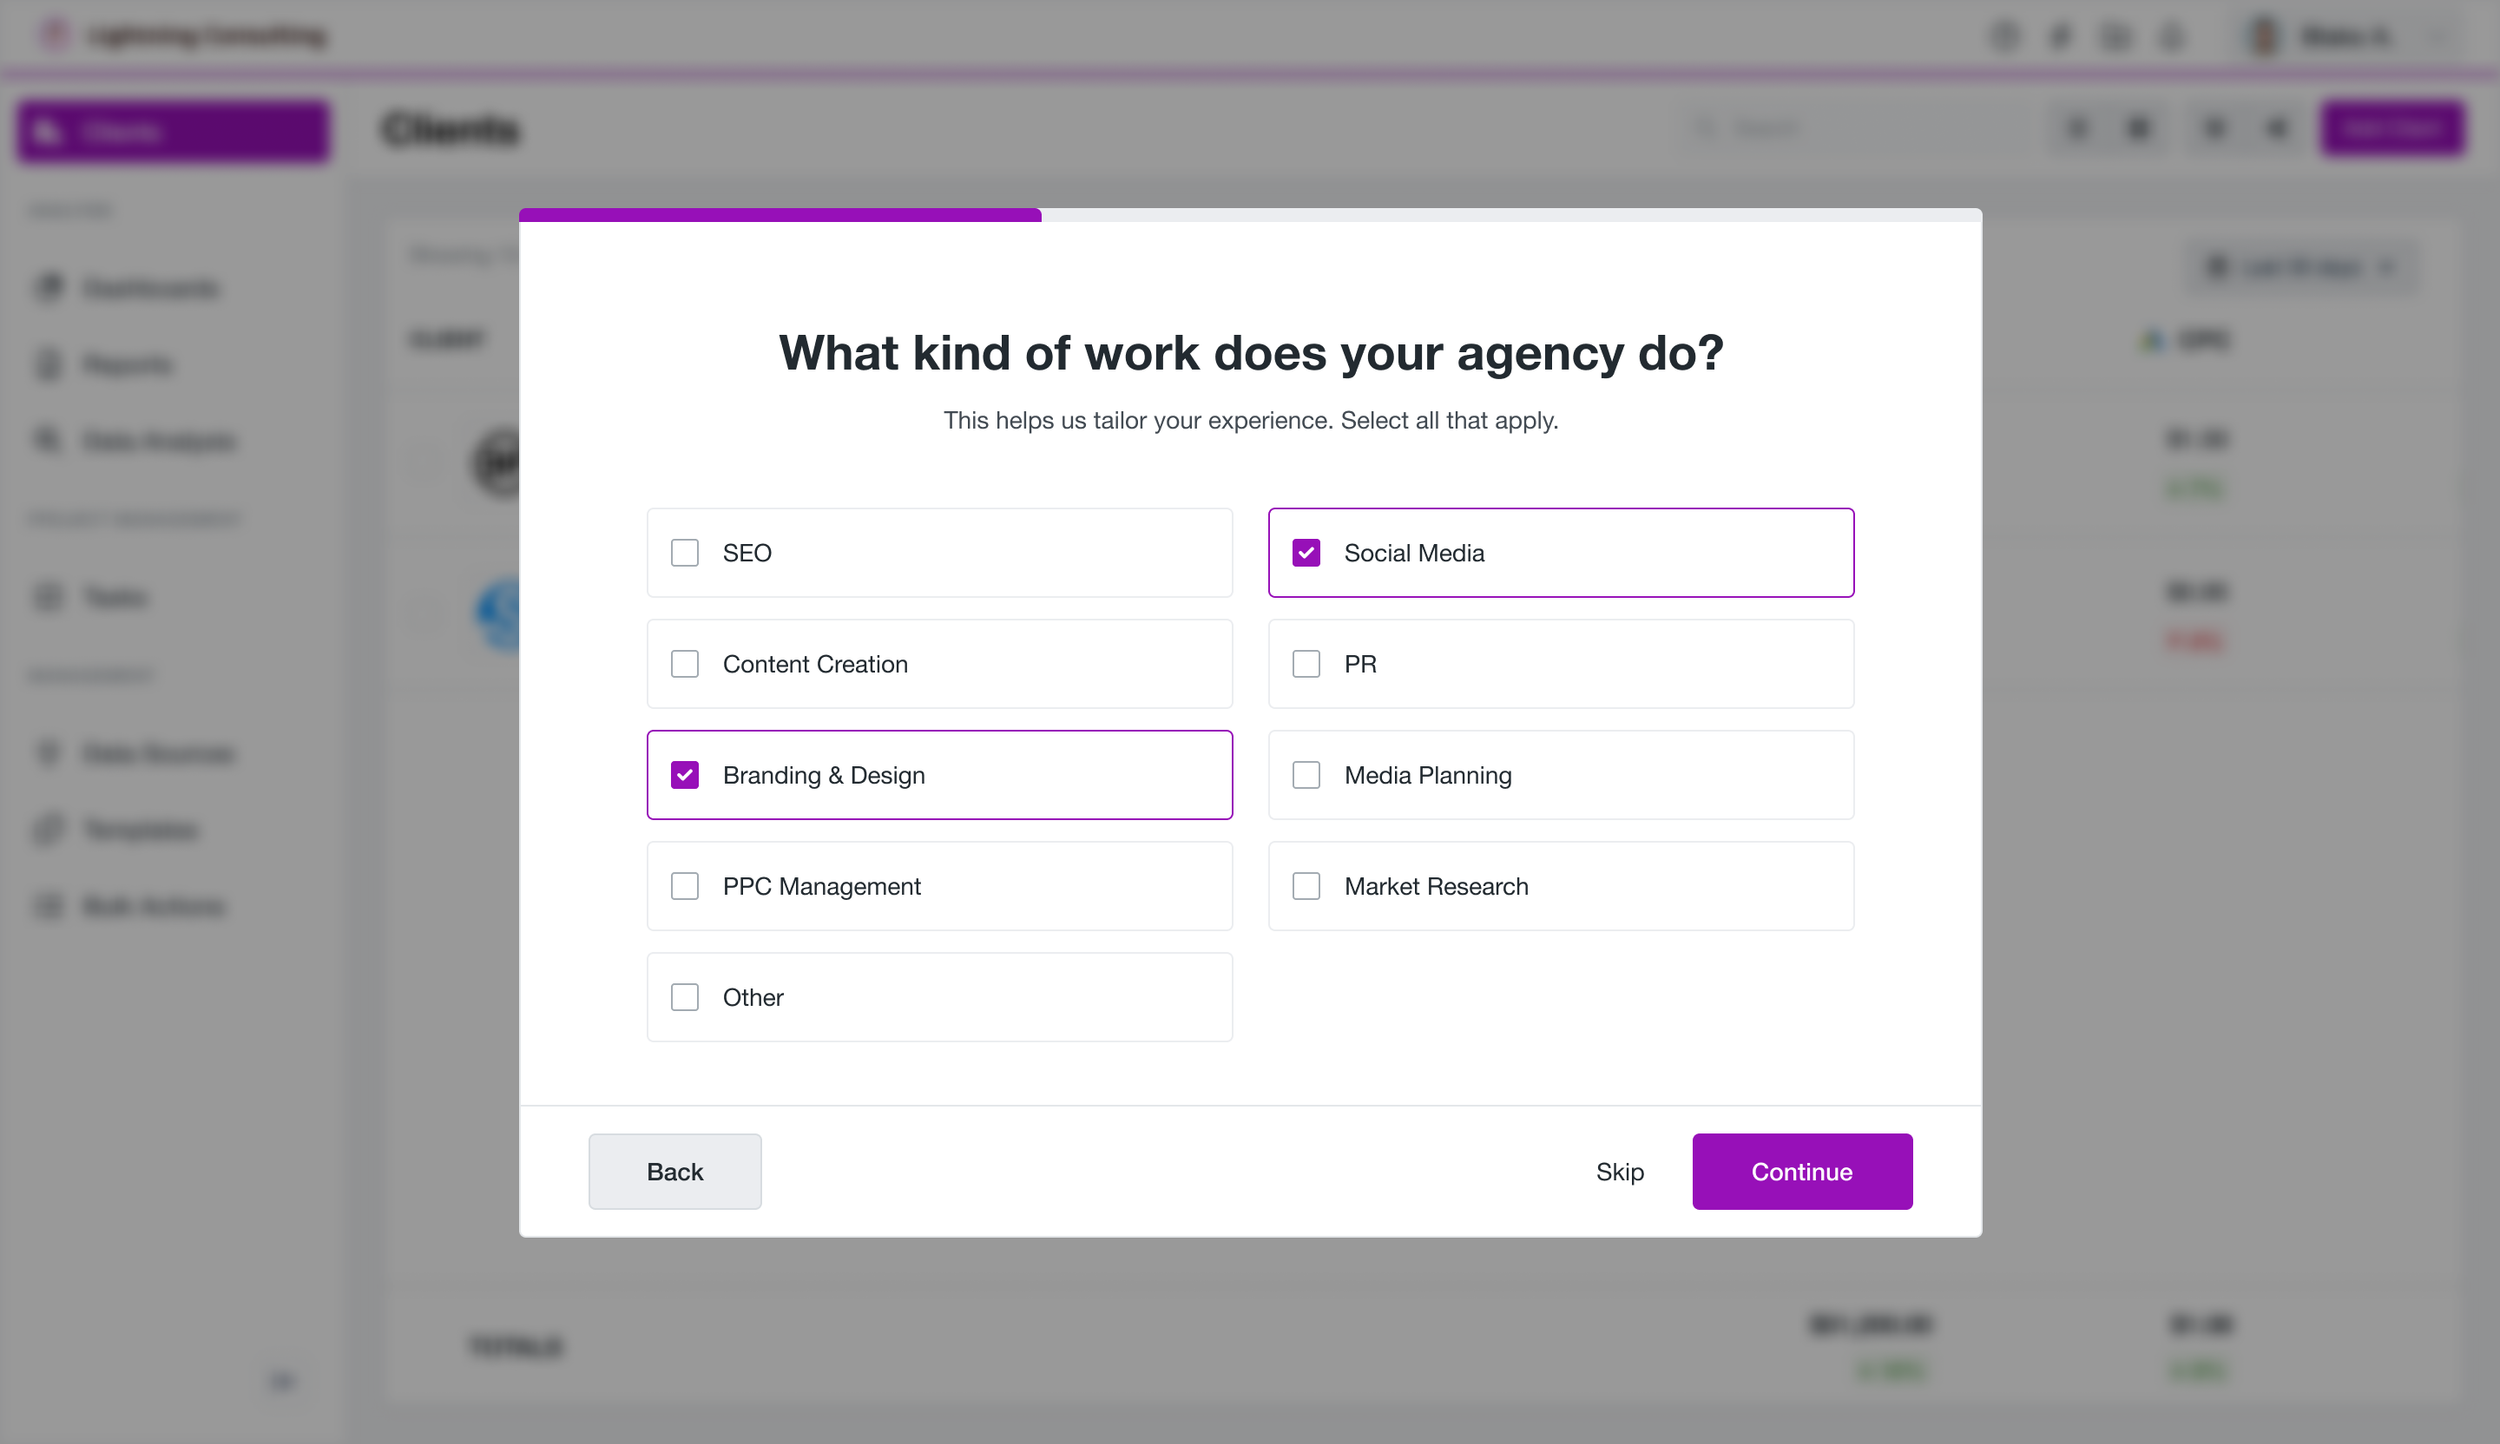
Understand Their Work
For agencies, capture the types of work they do through a multi-select question, giving us a clearer picture of how they use the platform.
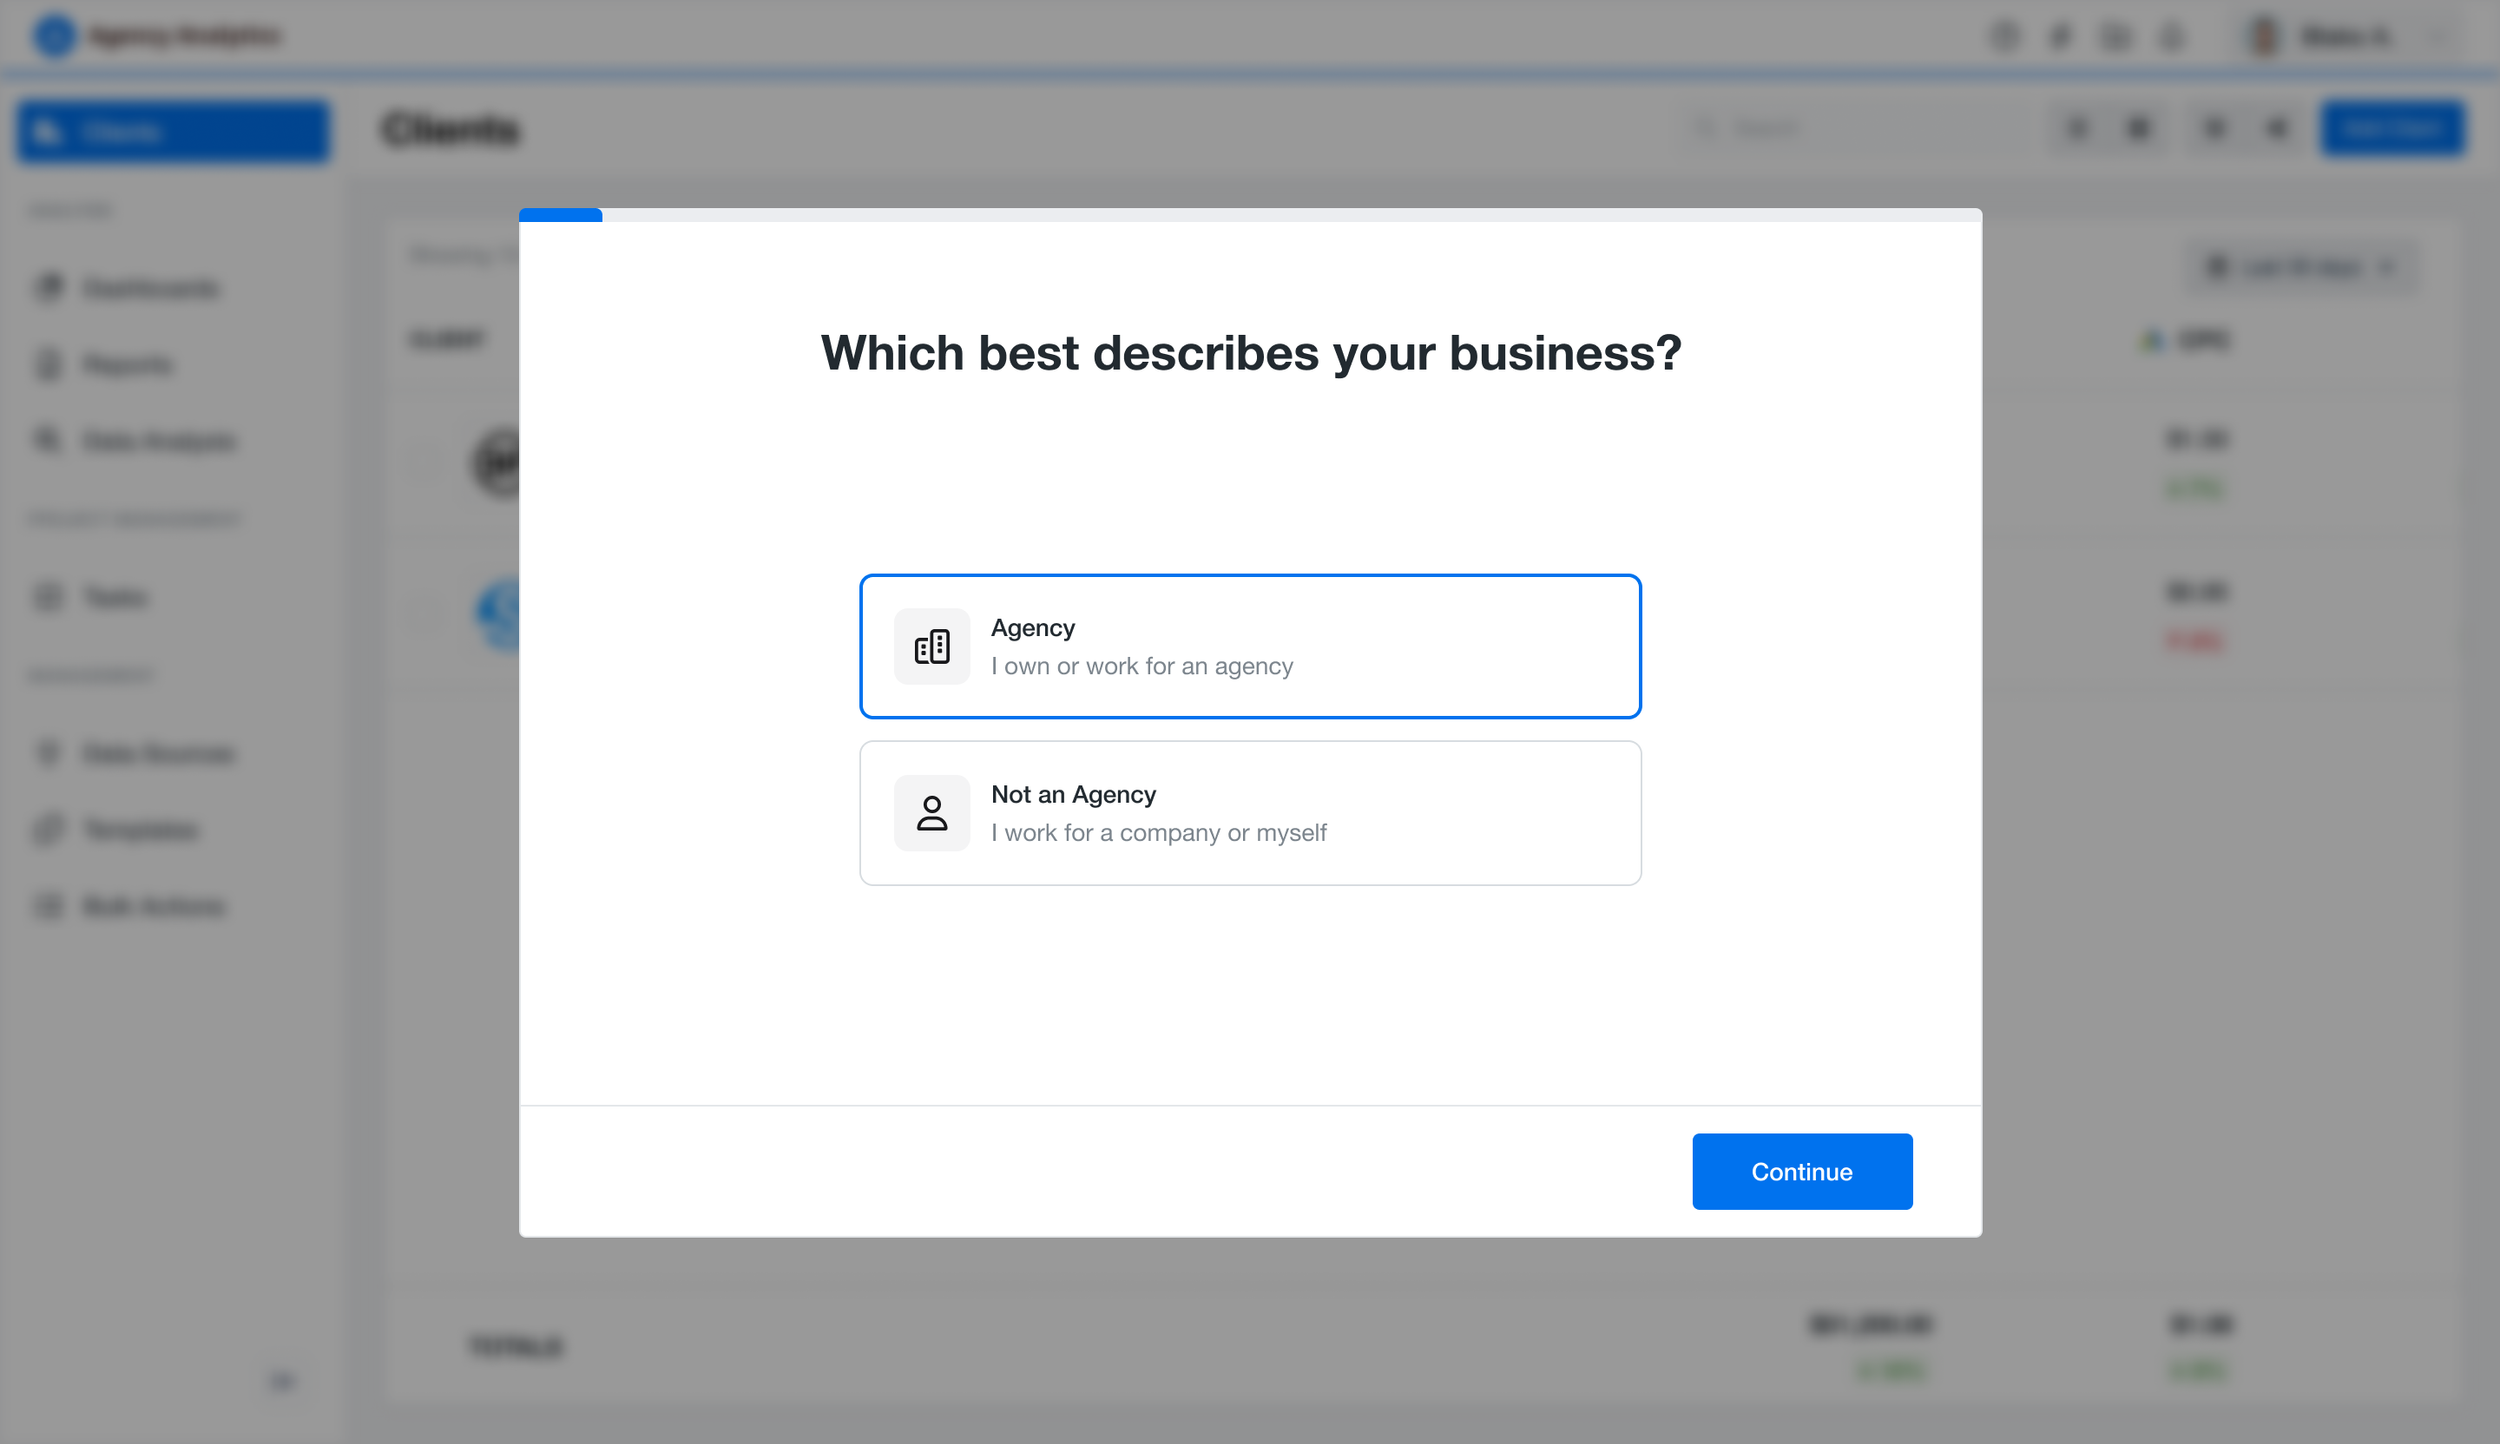
Identify the User
Capture whether the user is an agency or another type of business, allowing us to personalize the questions that follow.
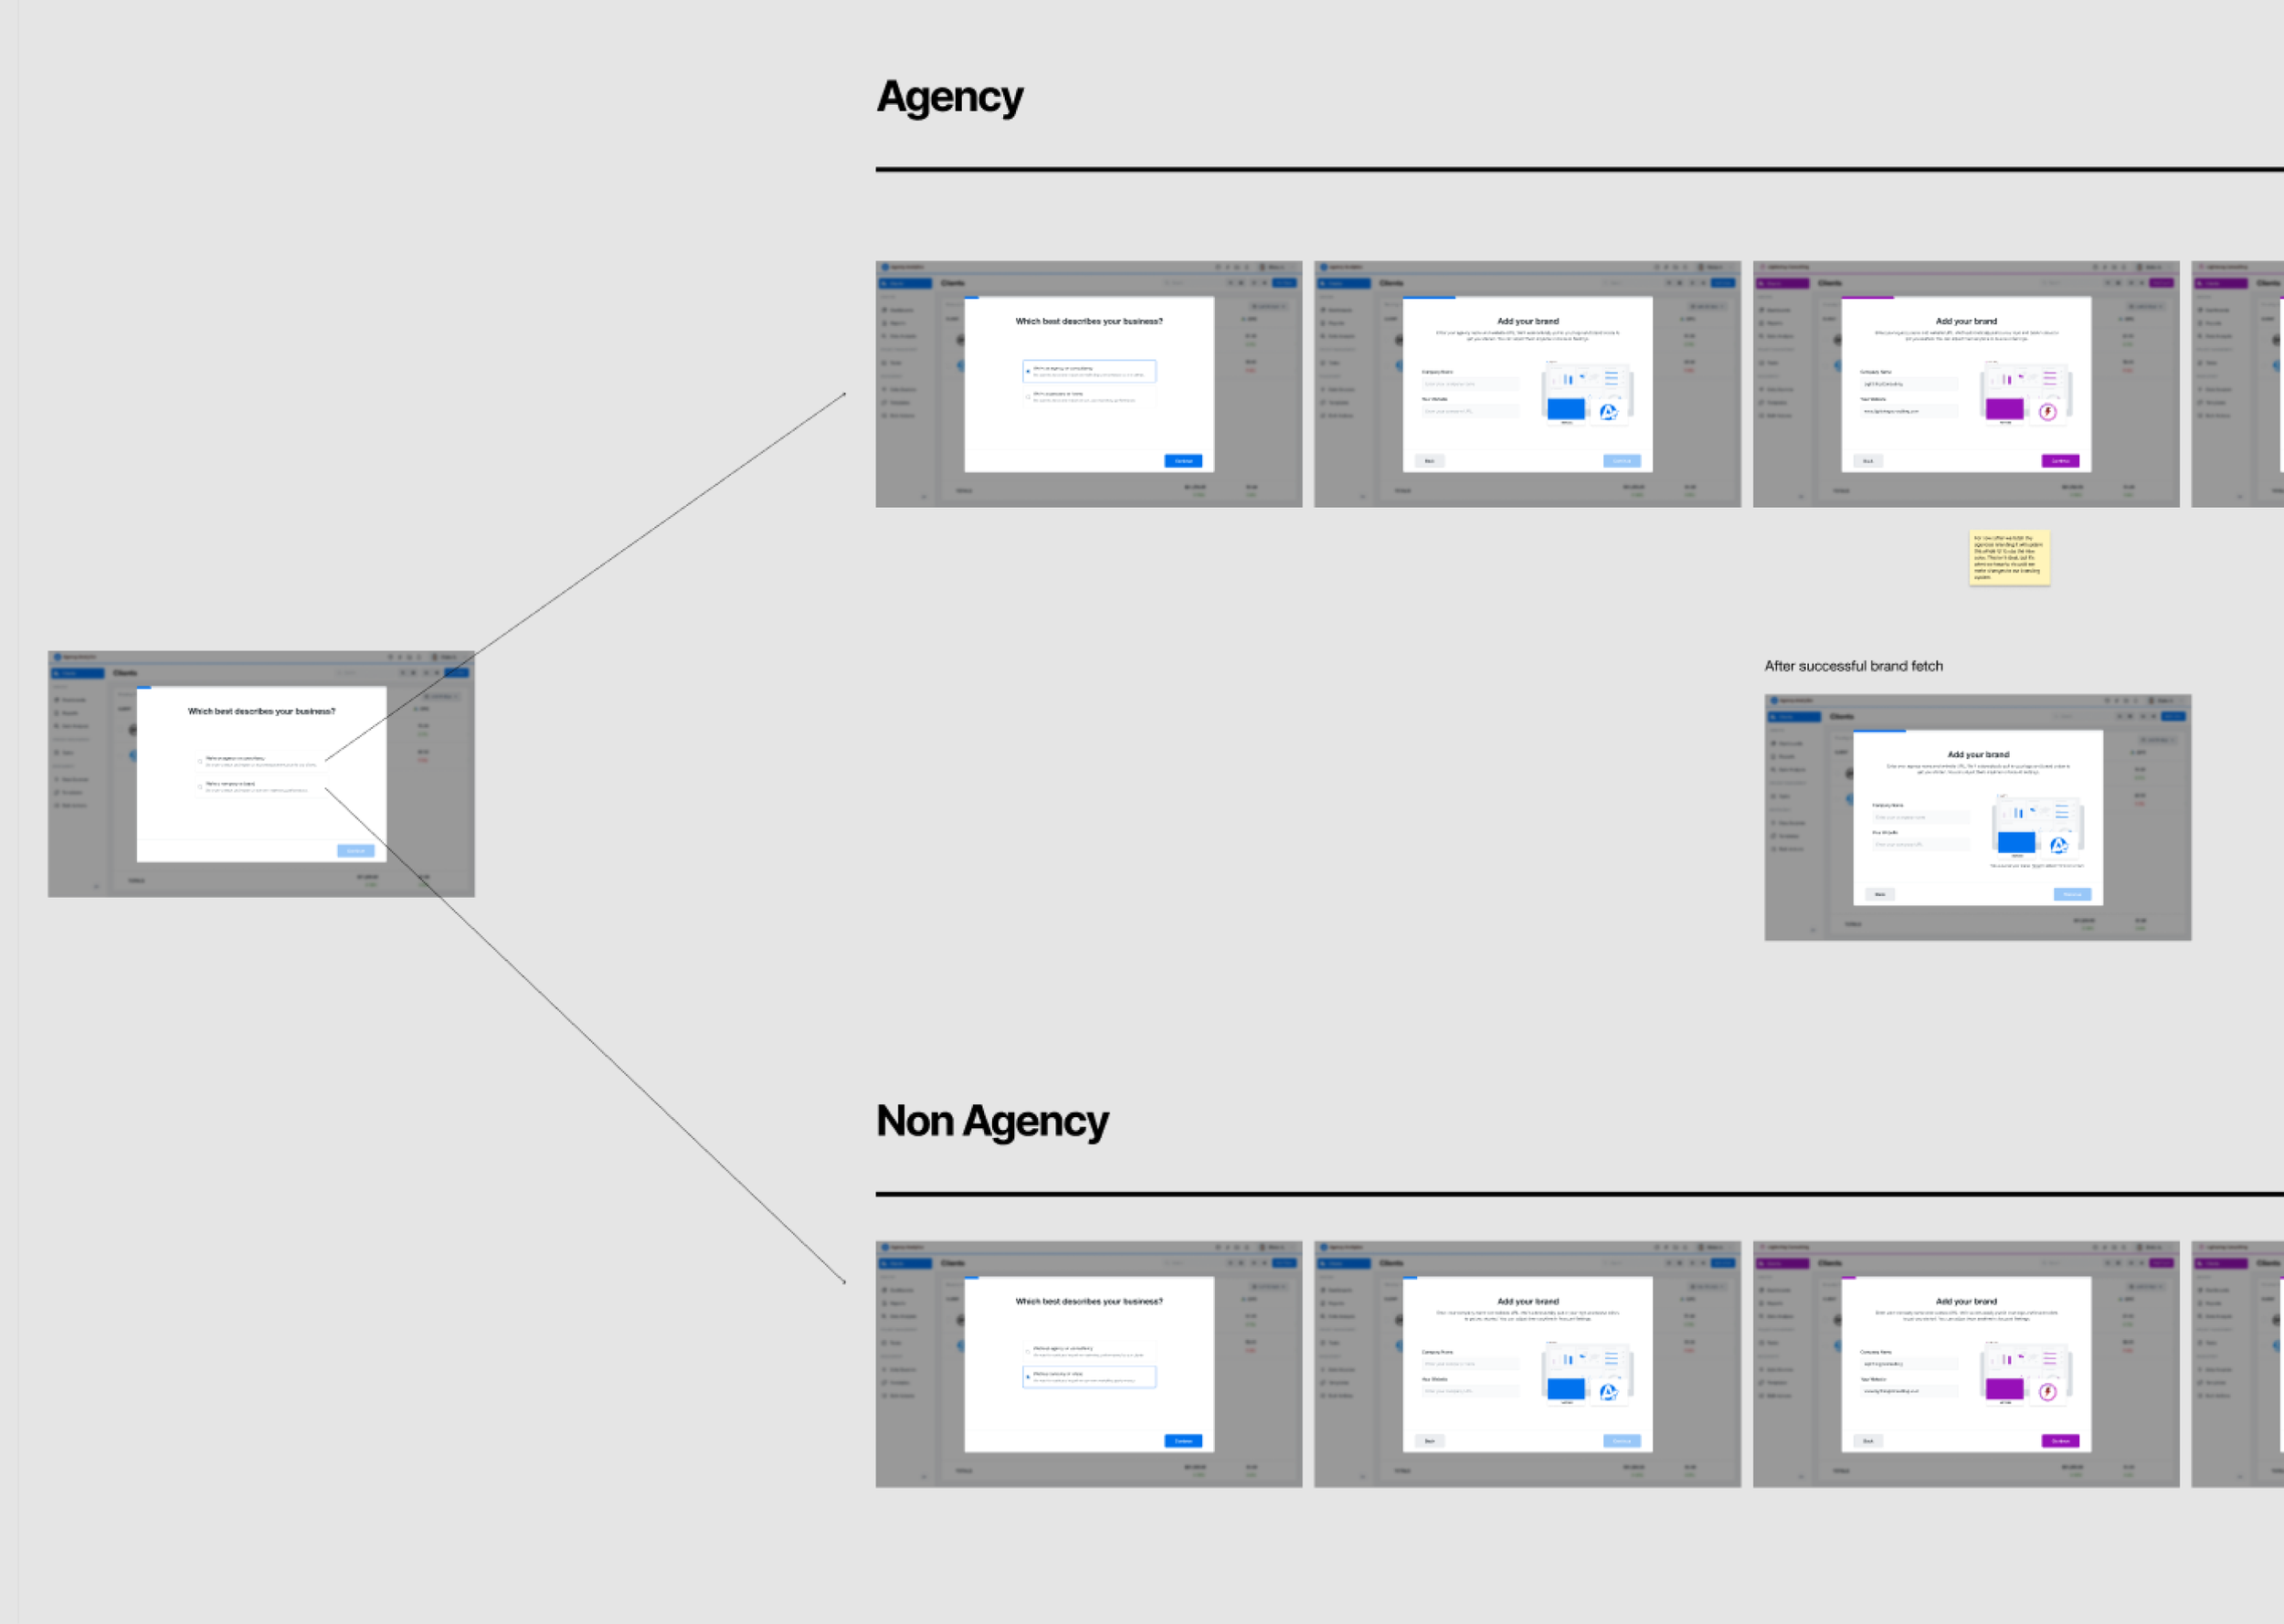
Tailor the Journey
Different user segments receive different onboarding questions, keeping the experience relevant while collecting the information most useful for understanding their needs.
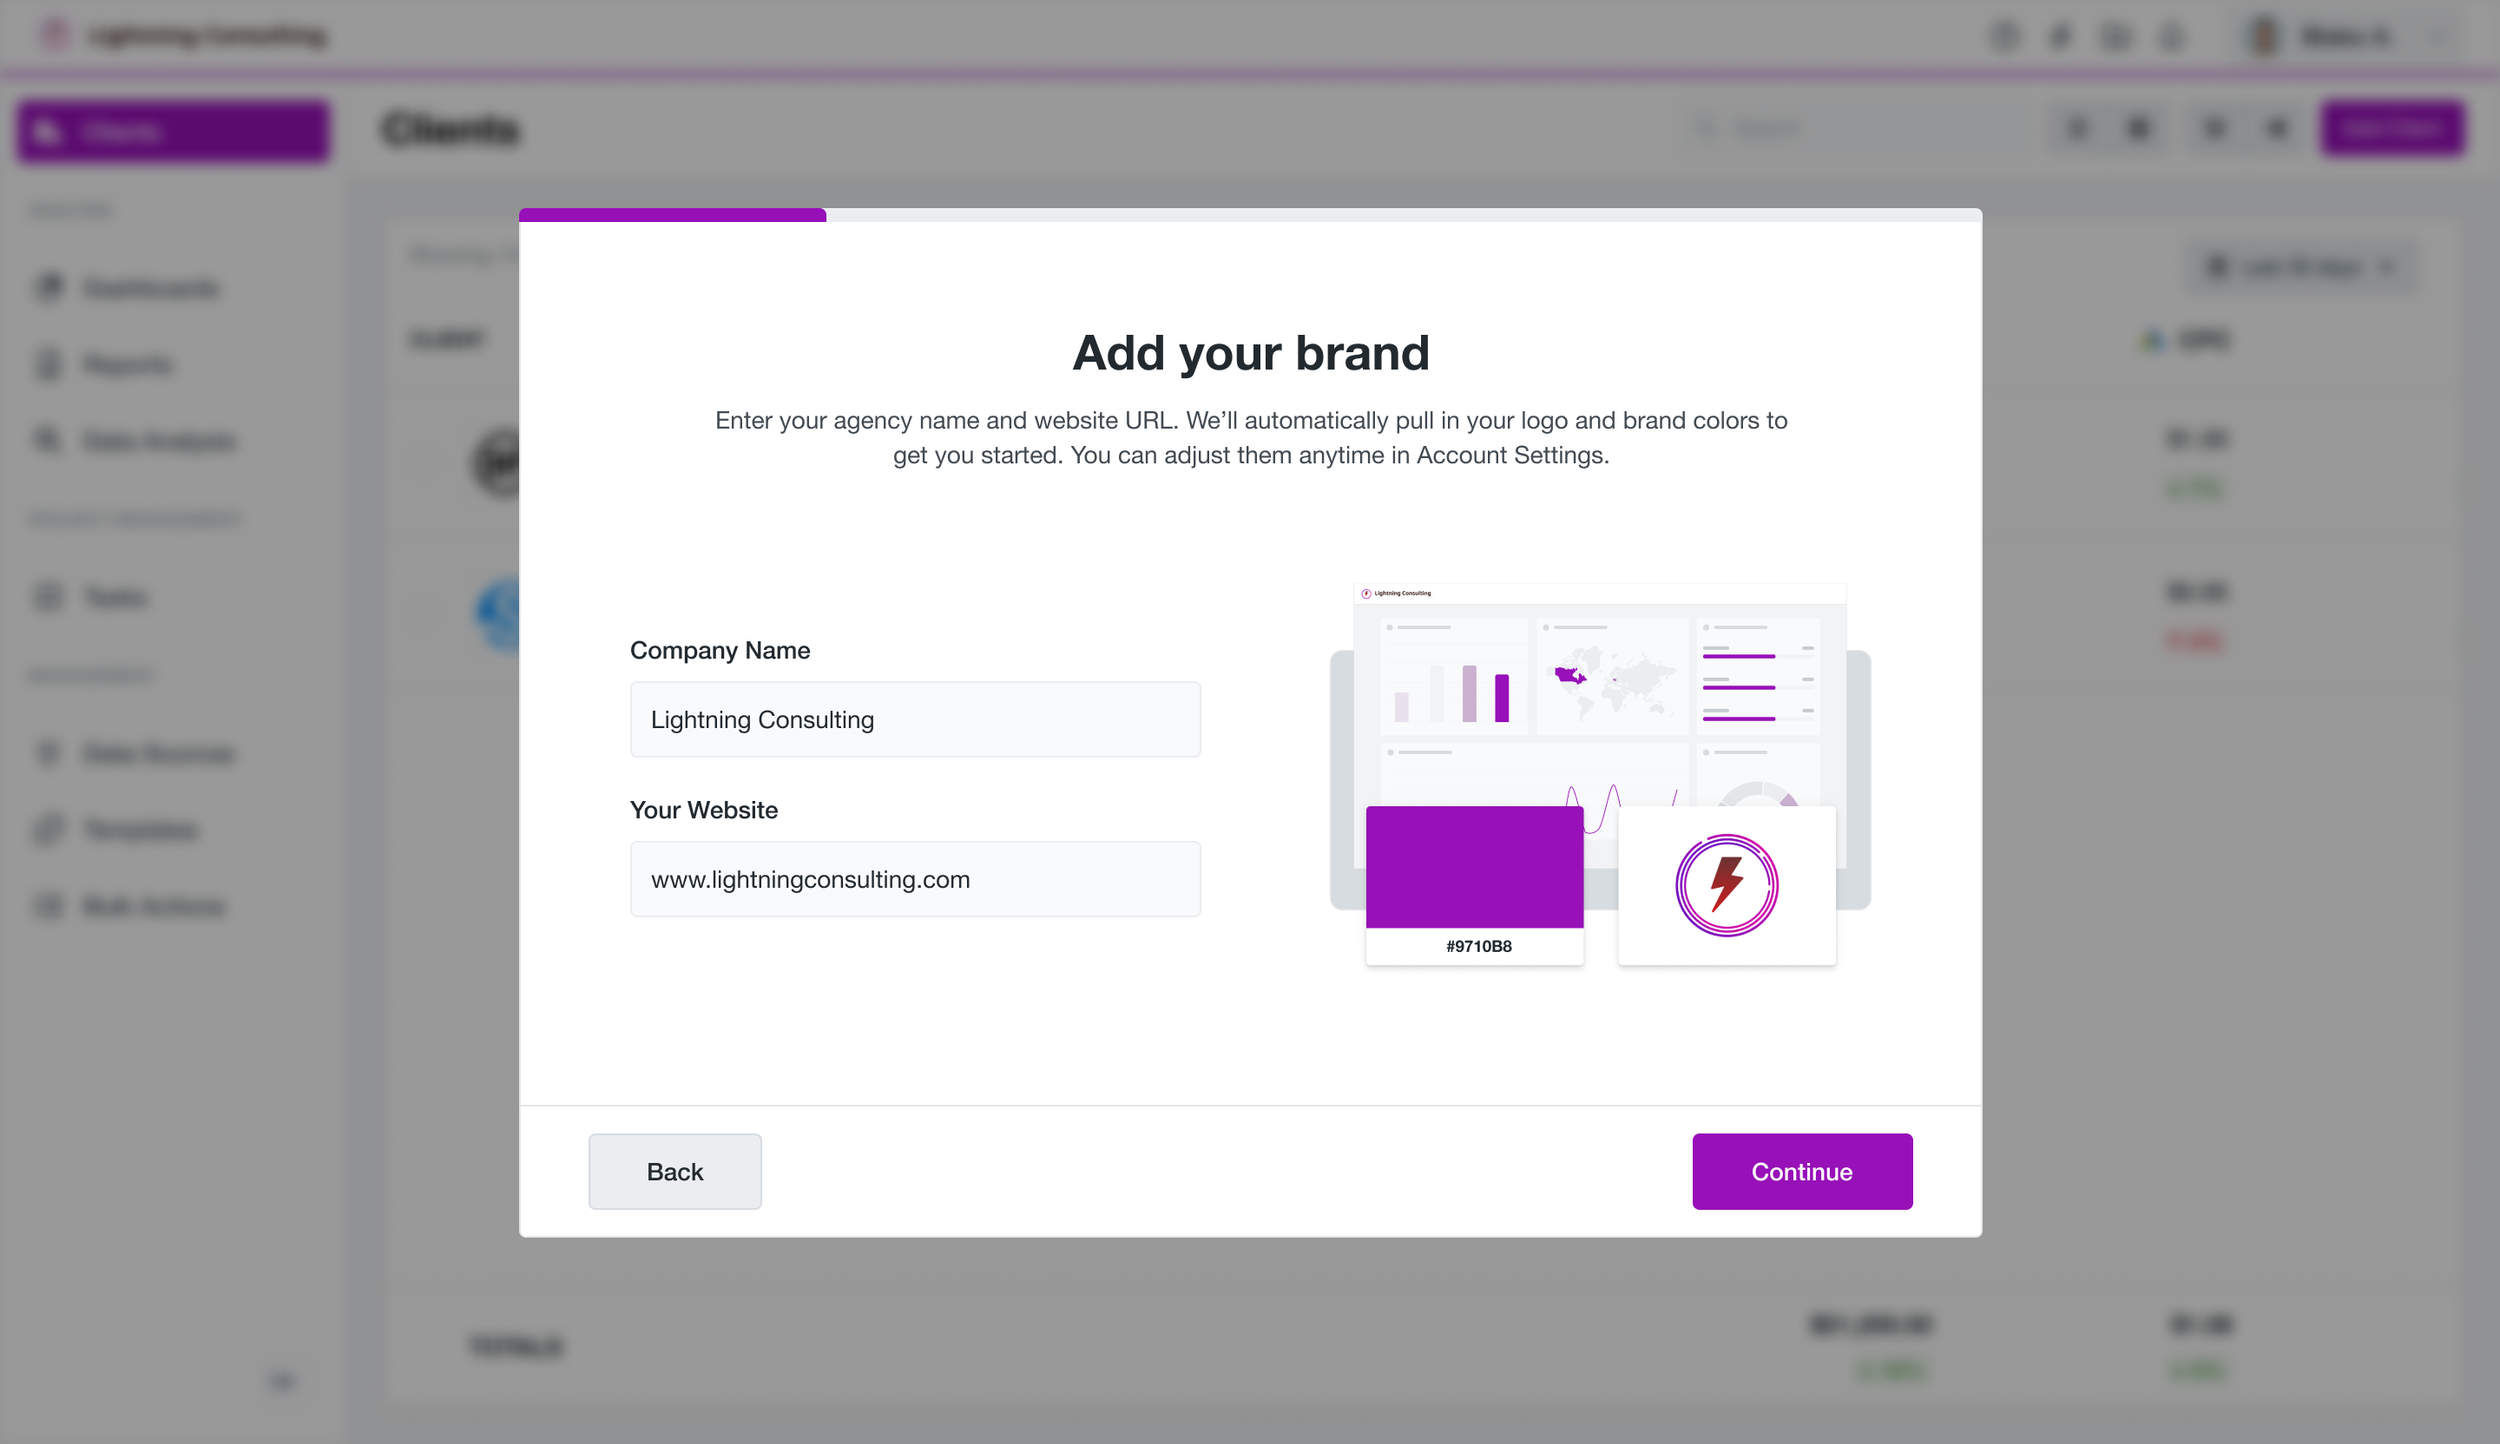
Make It Feel Like Their App
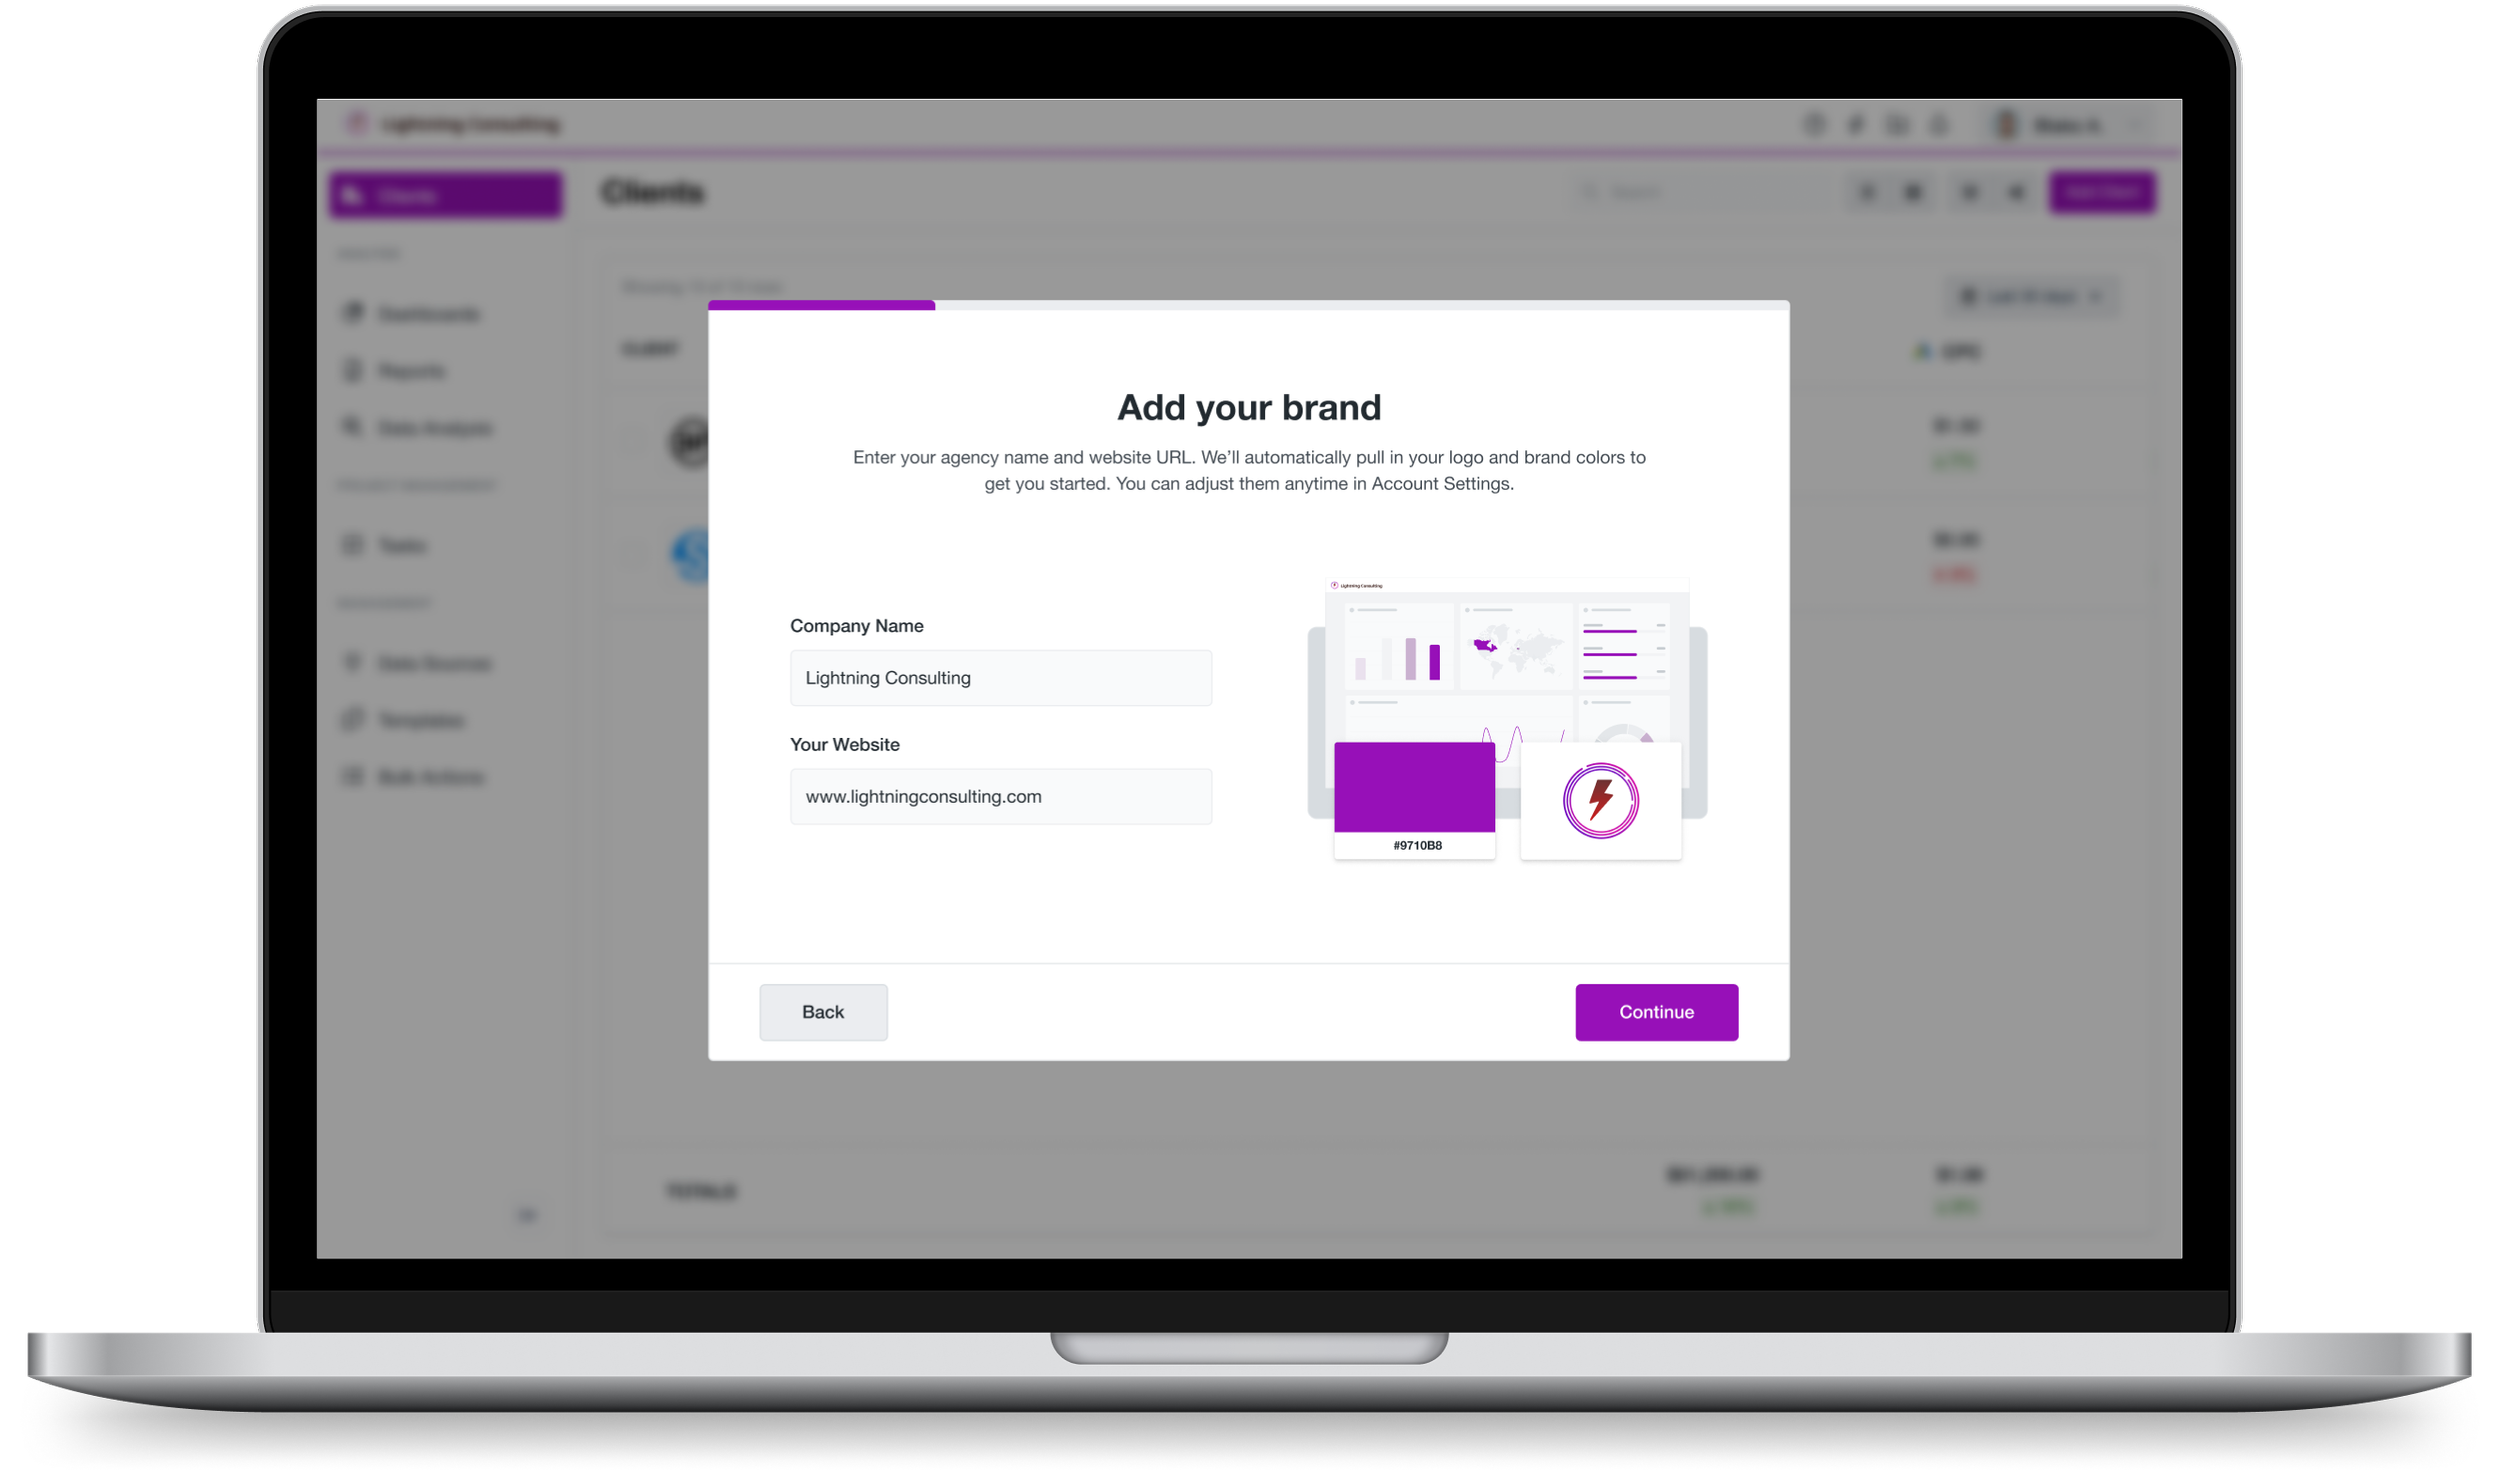
When users enter their agency or company URL, we pull in their branding and preview it in the onboarding experience. Building excitement by showing them what the platform will look like with their own brand.
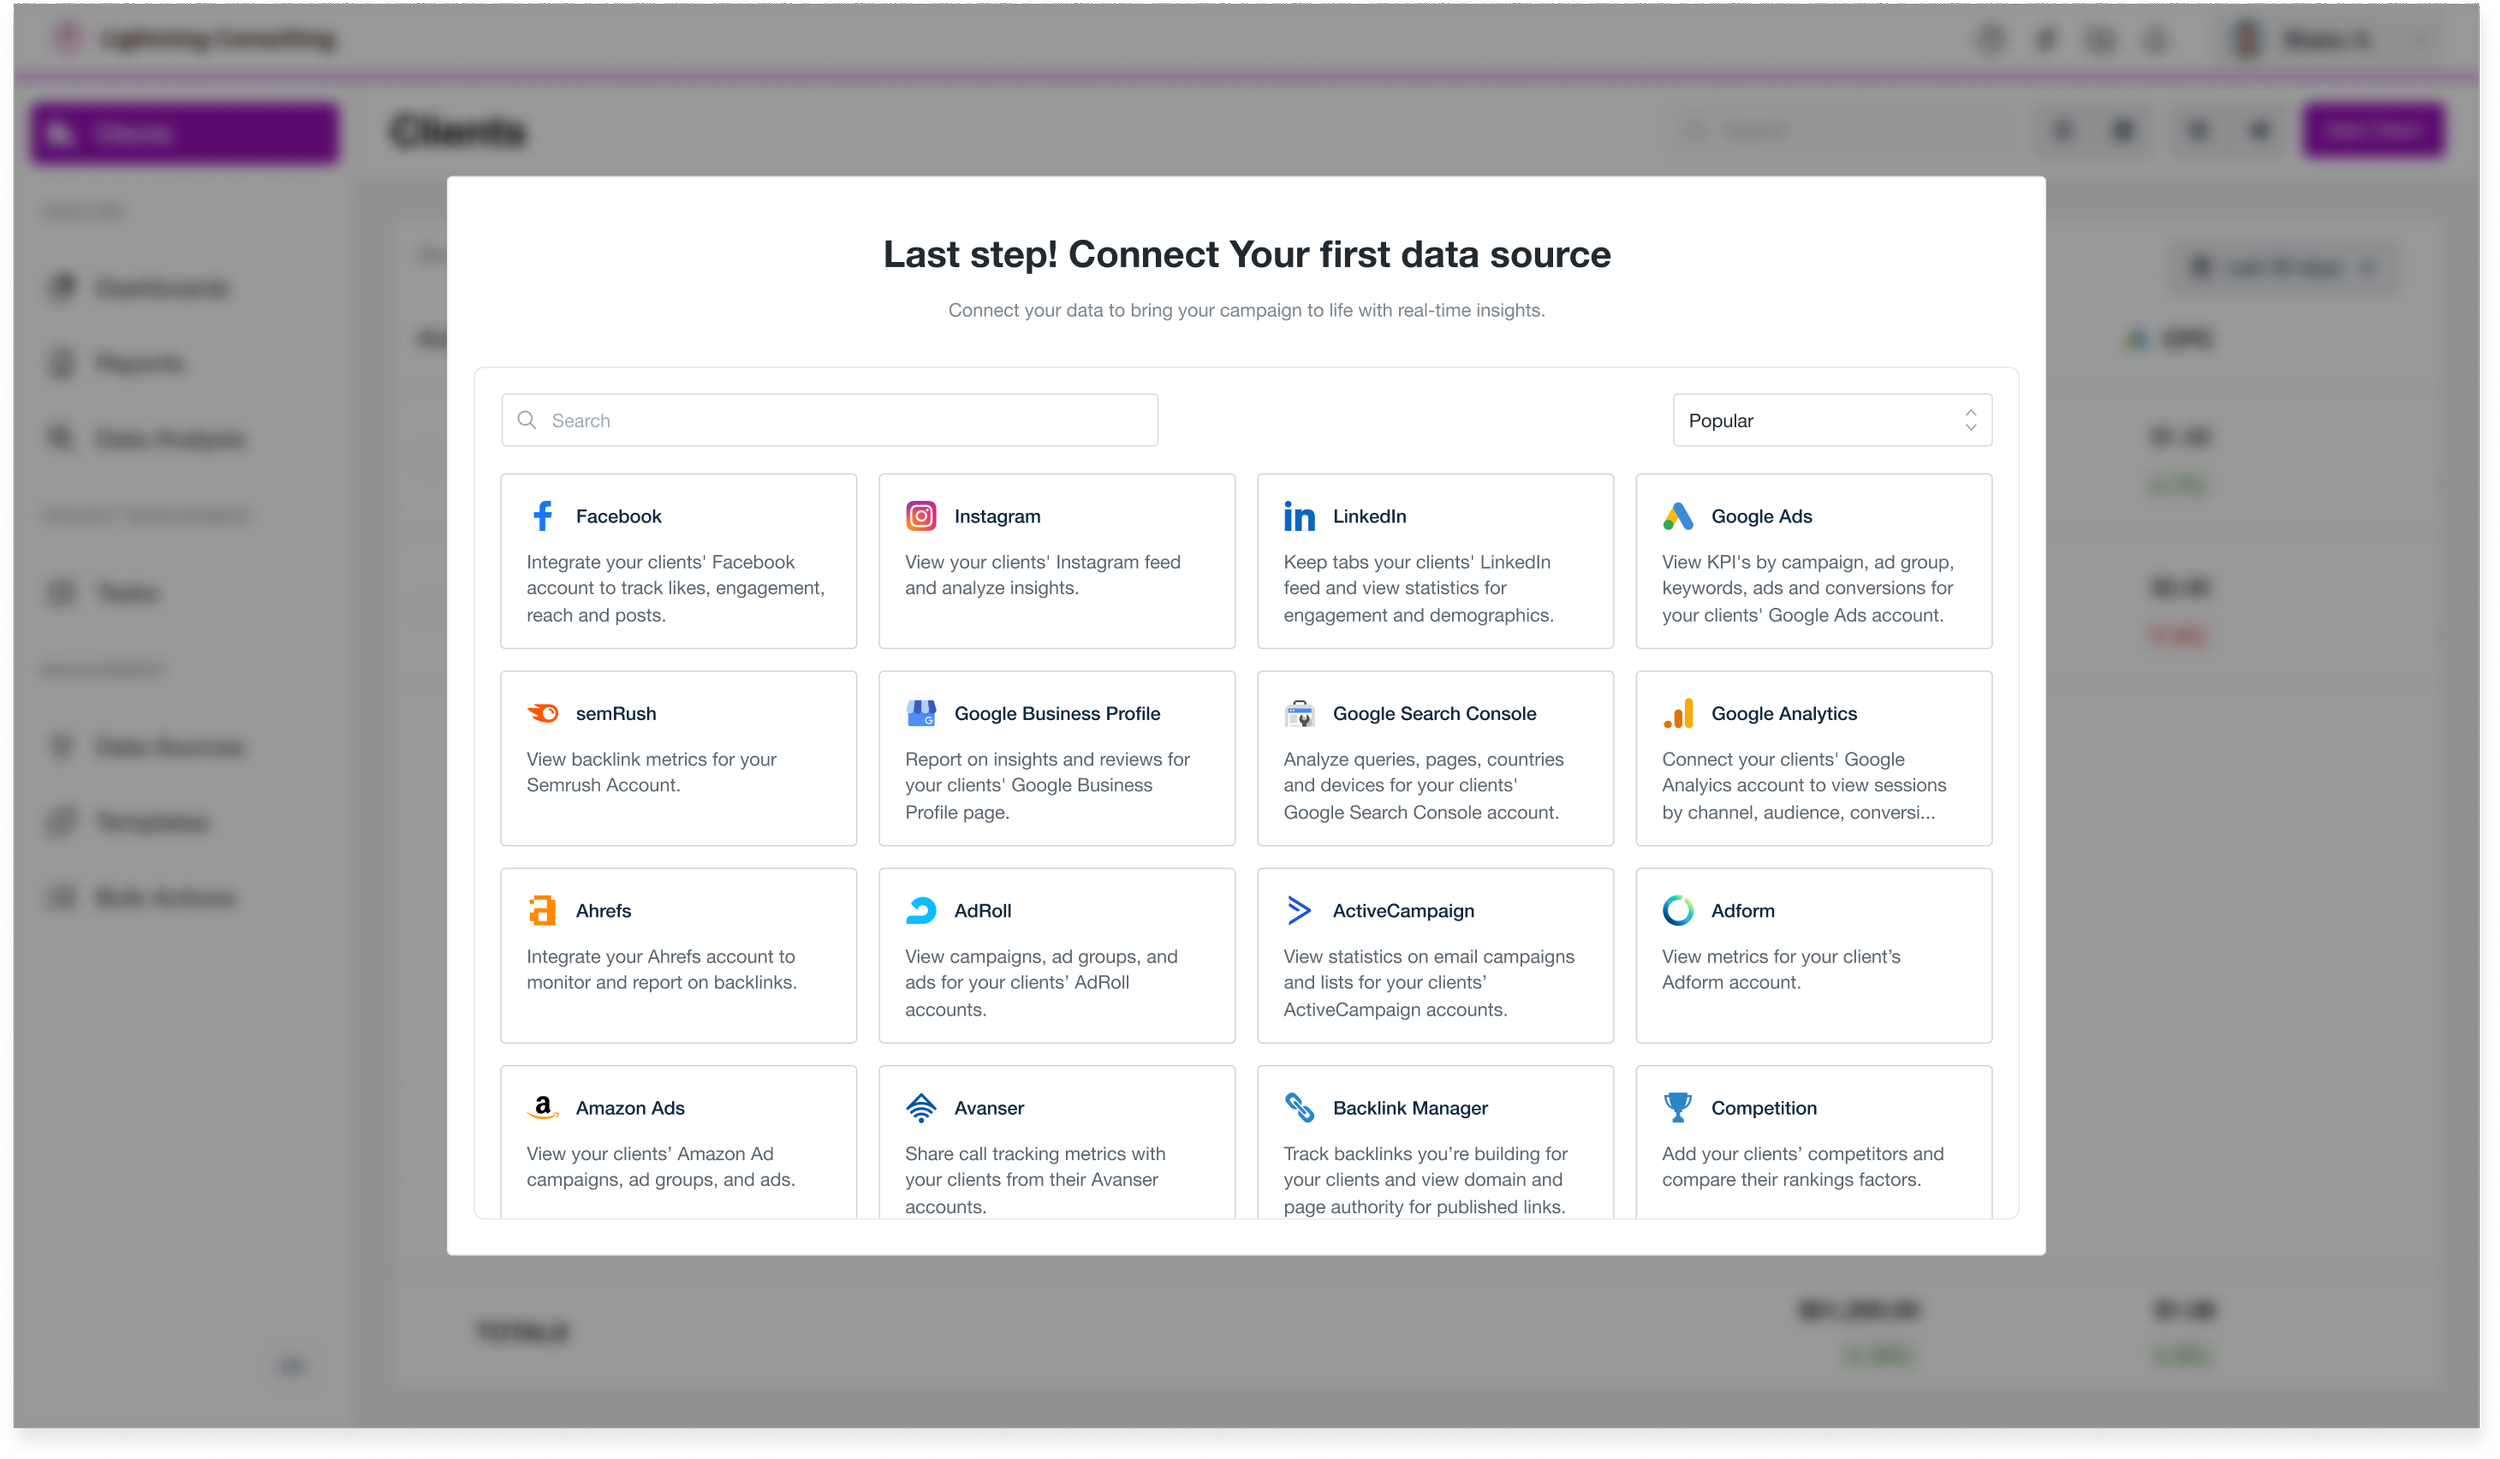
Connect a Data source
Bringing data-source connection into account setup to encourage users to connect their data earlier in the trial. The goal was to help users reach value sooner by getting their data into the platform earlier.
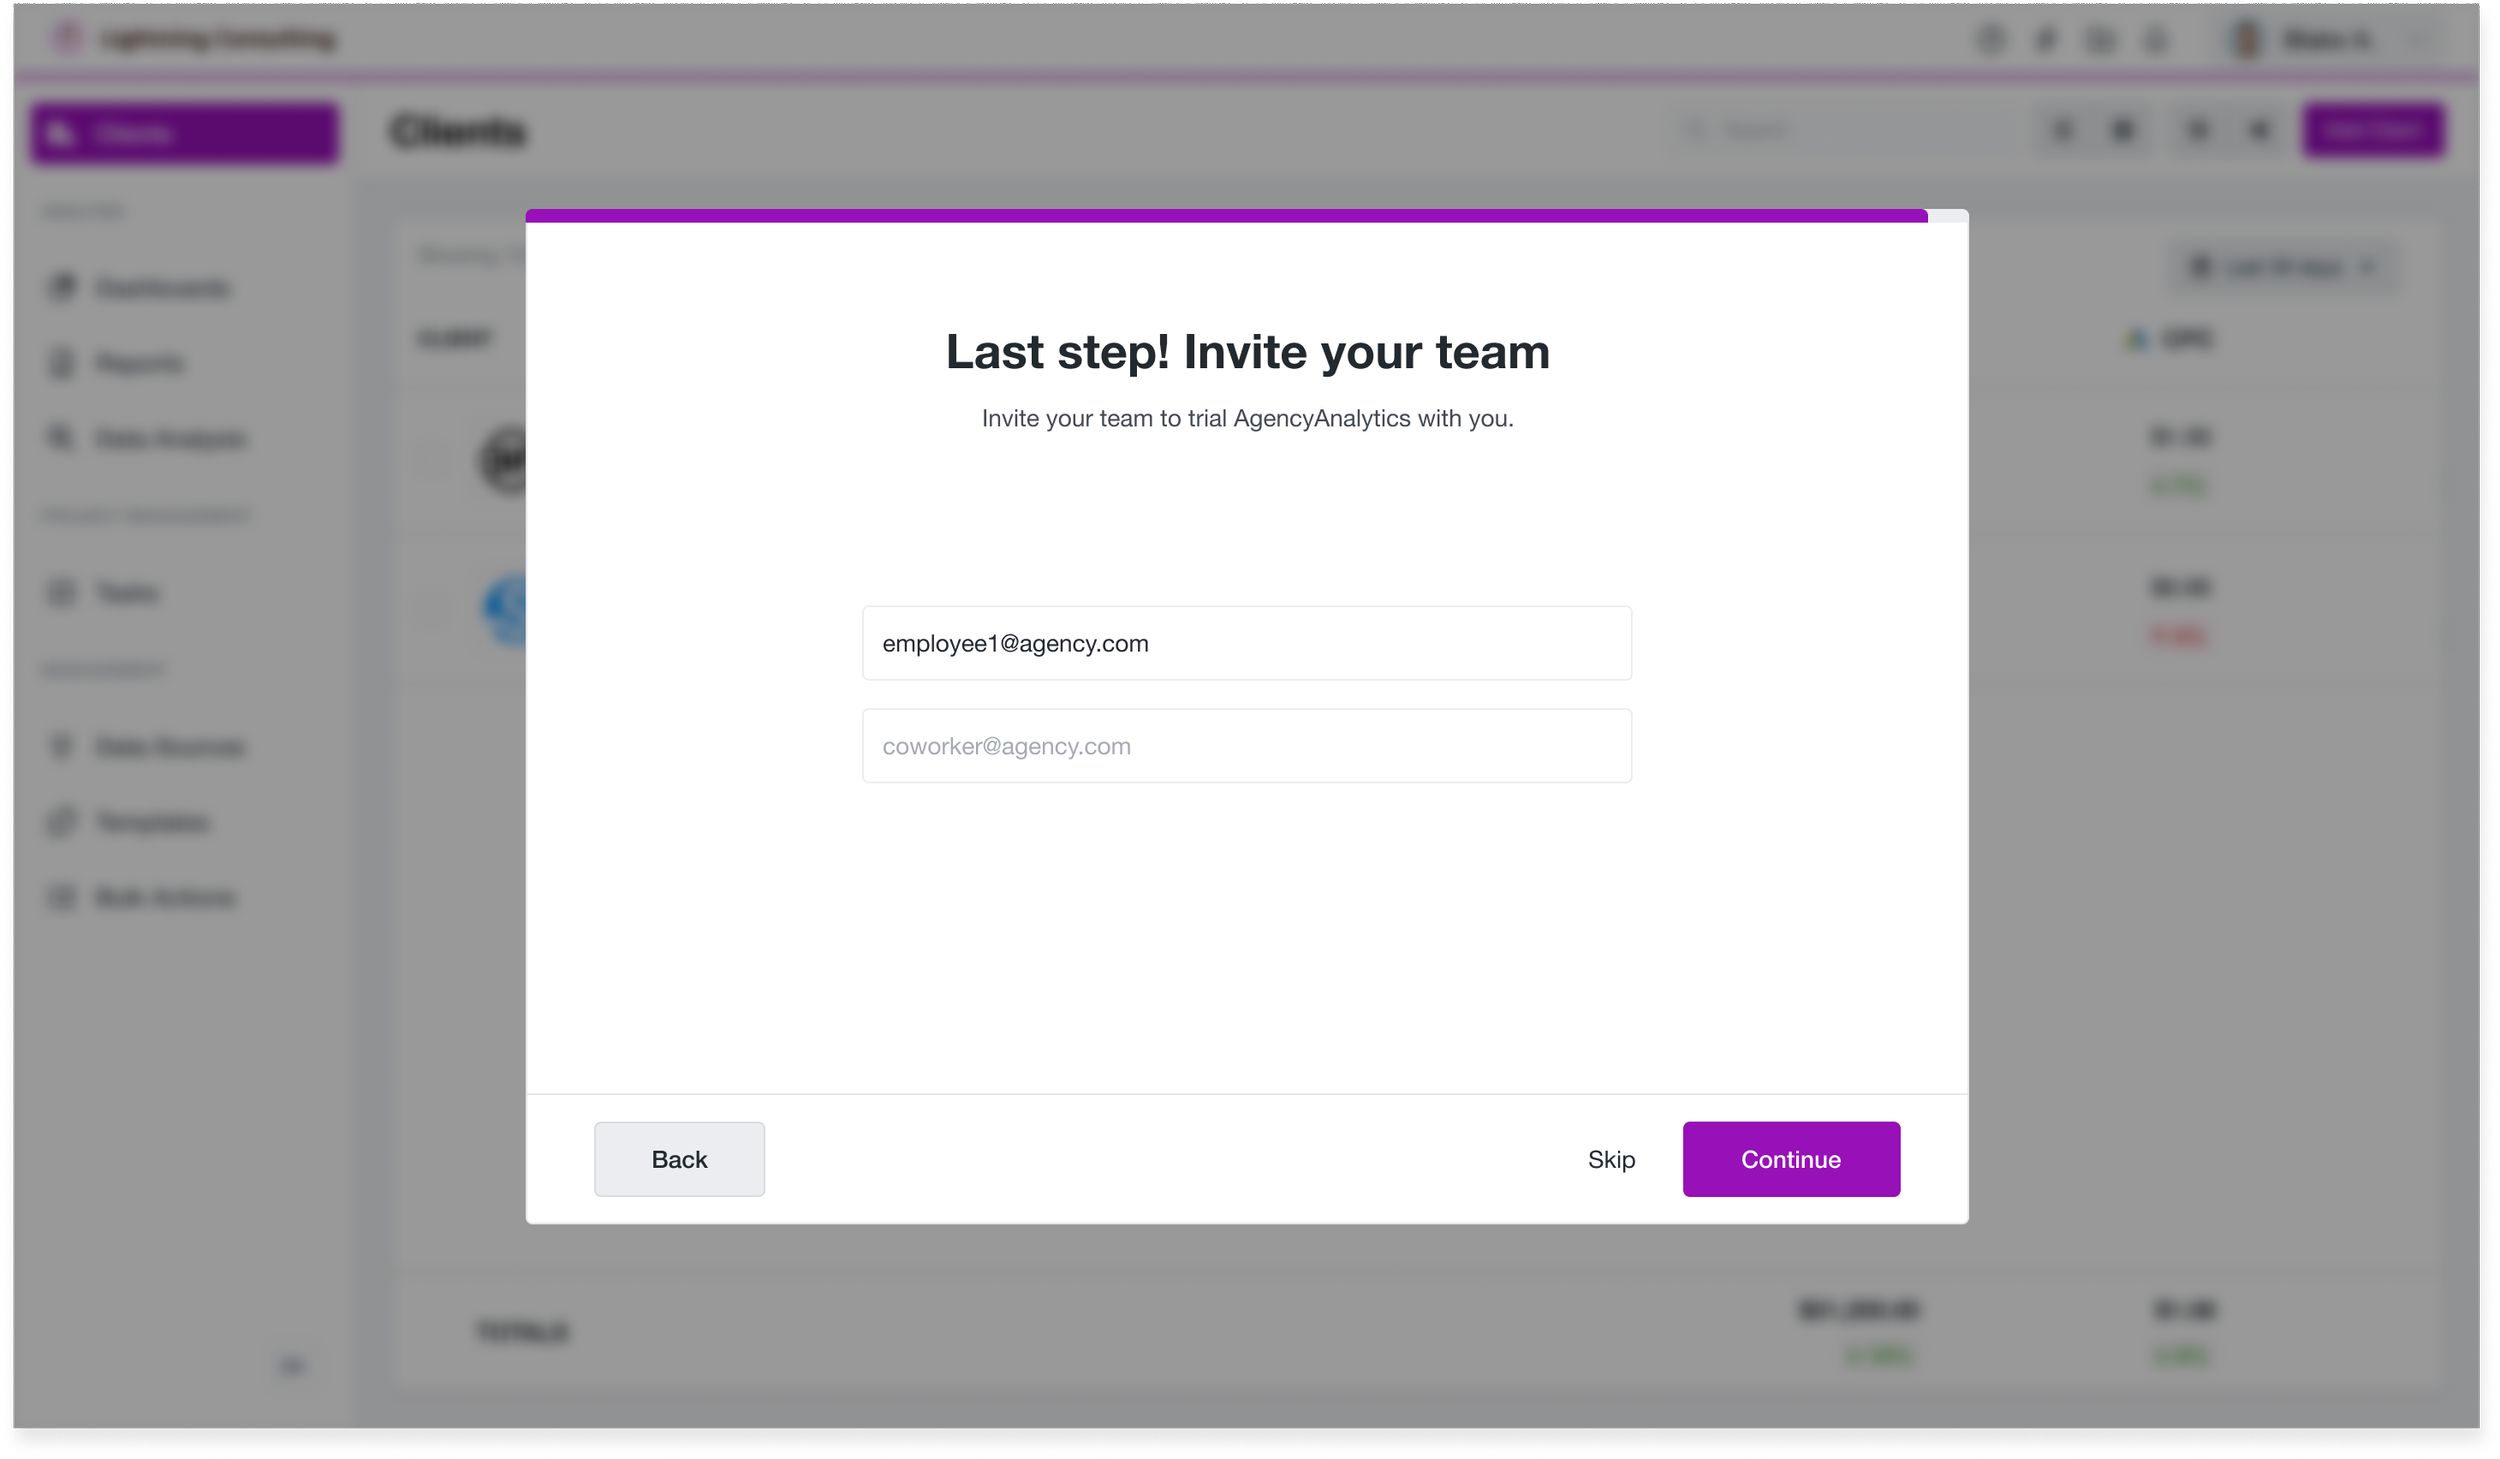
Trial with your team
Let agencies invite their staff to trial the platform alongside them. Users who invited their team were more likely to activate and convert, suggesting that team involvement could be an important activation signal.
The Bigger Problem
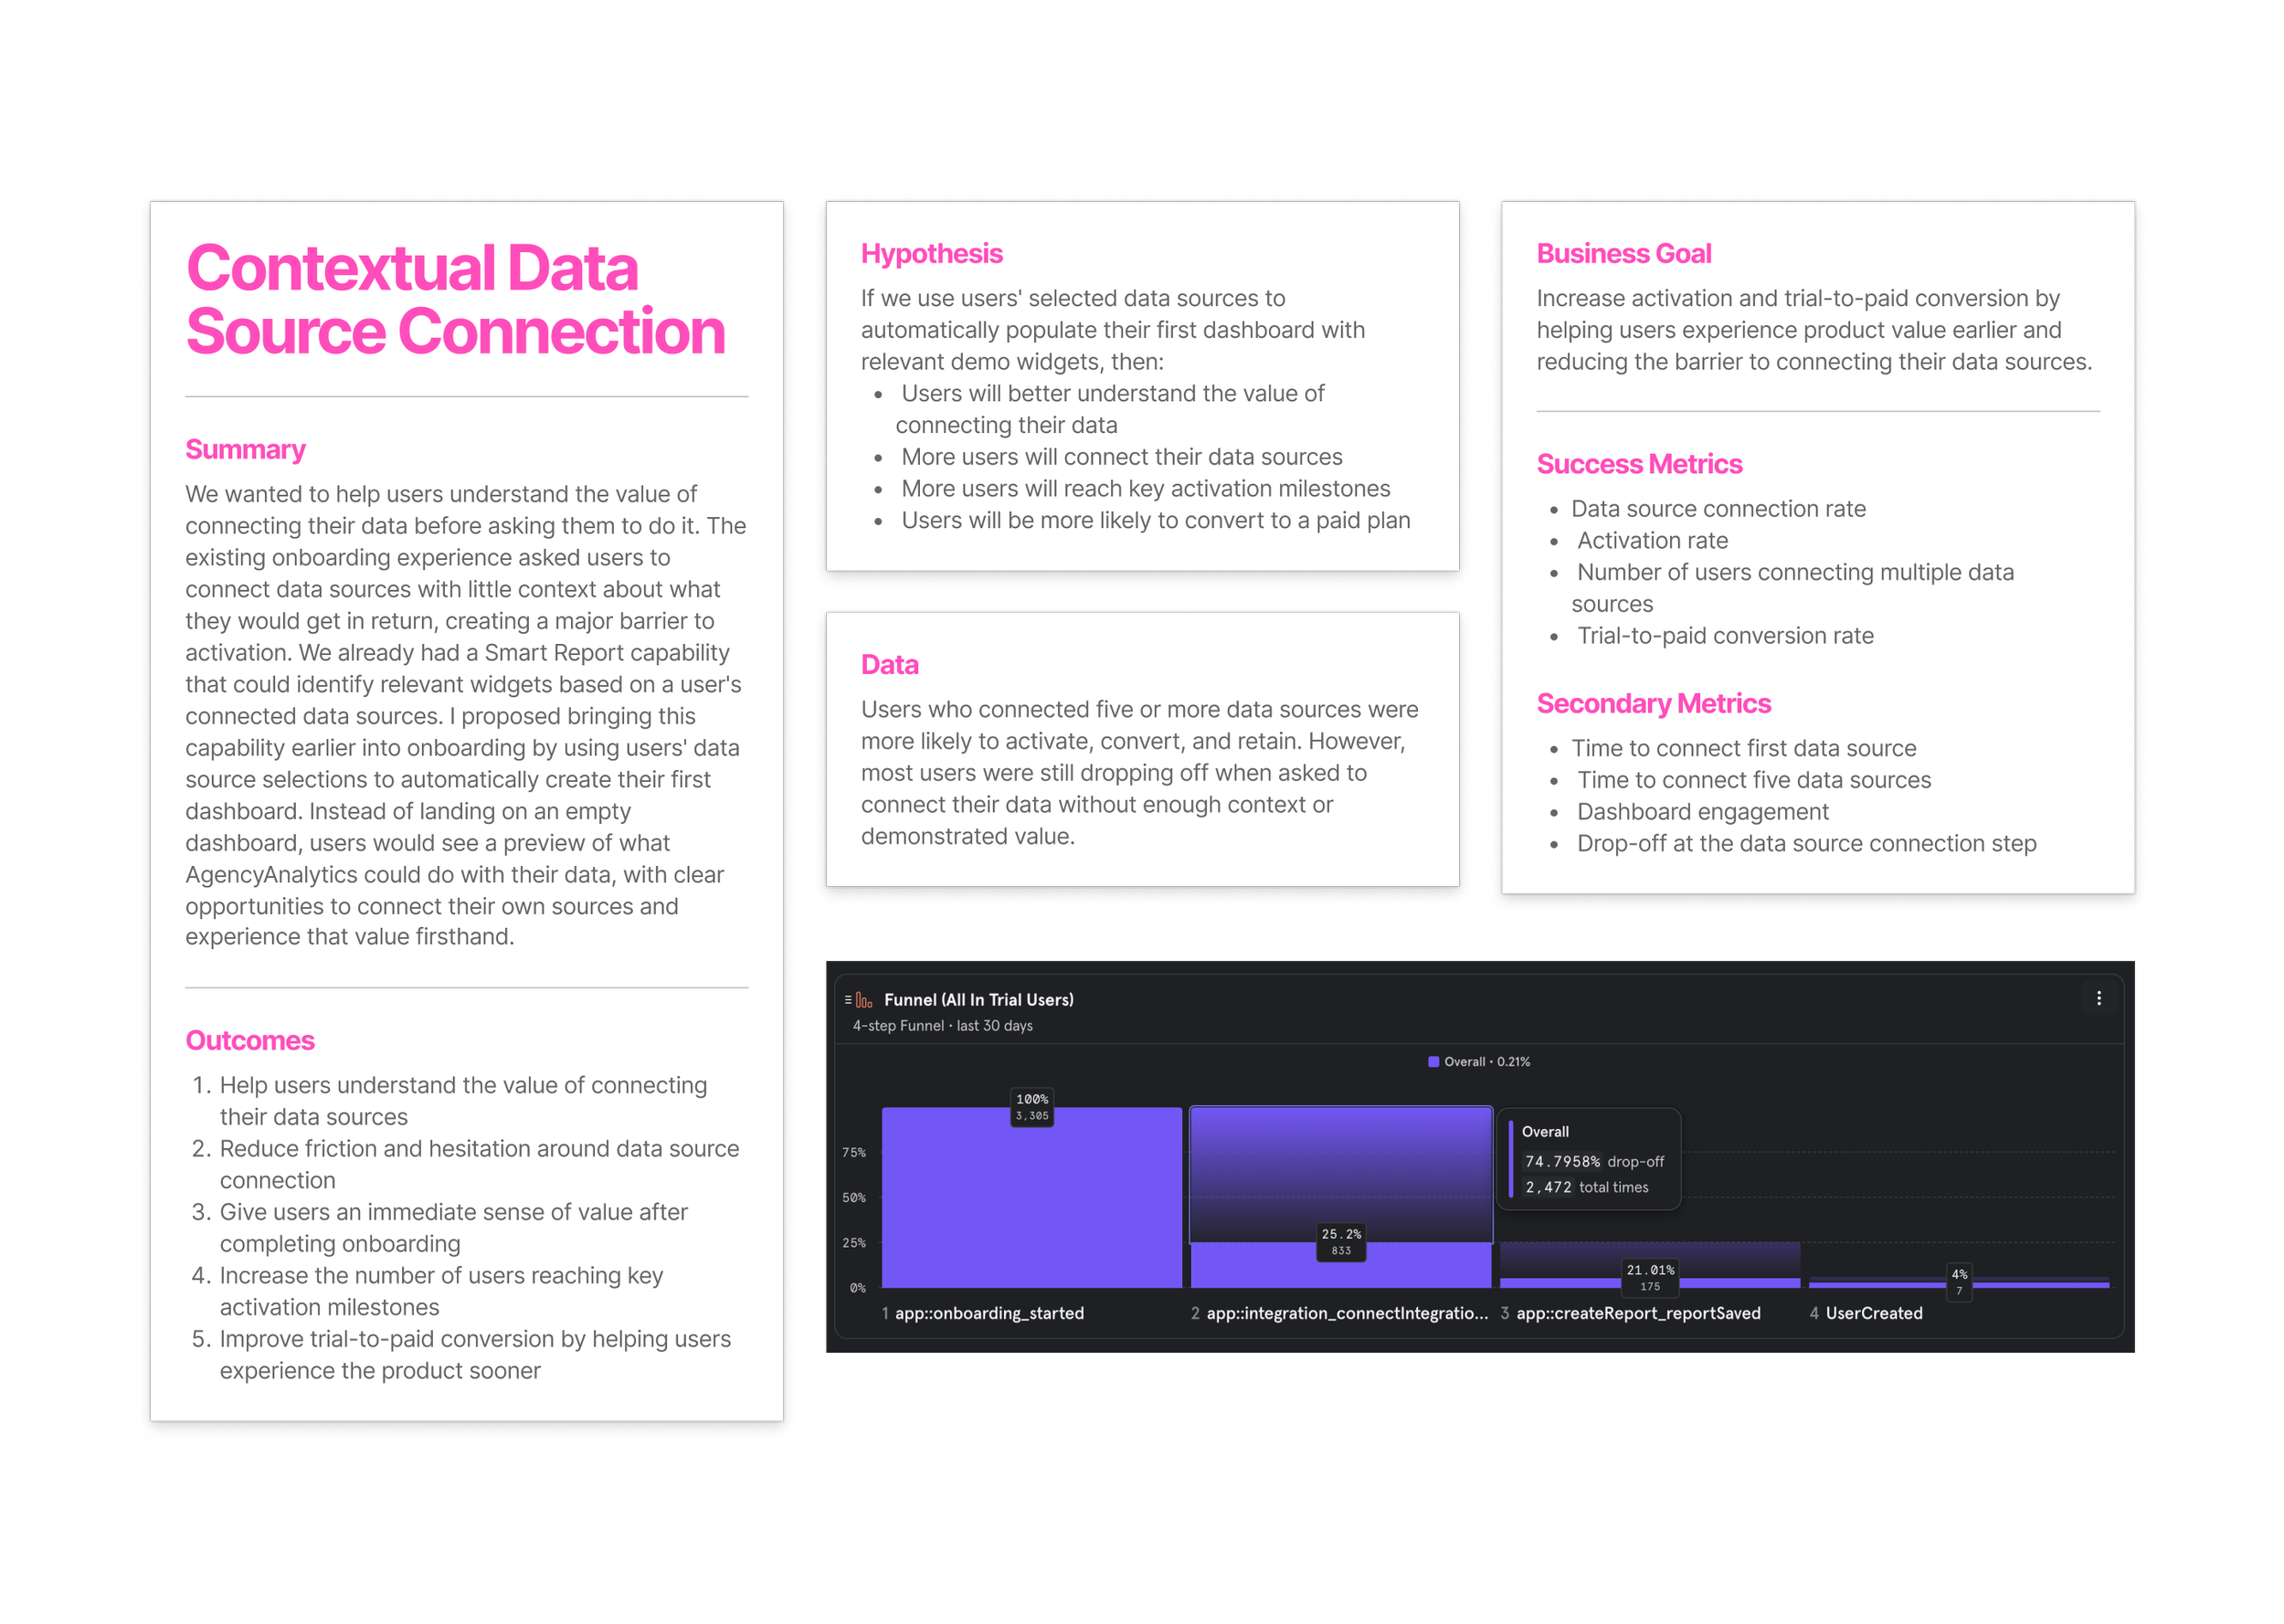
Our onboarding experiments helped us better understand who our users were, improve activation, and increase the number of data sources being connected. But there was still a gap in the experience.
Even after completing onboarding, most users were still hitting a brick wall: connect a data source. Asking users to connect their data without first showing them the value of doing so was a big ask, and many users simply stopped there.
This led us to a new hypothesis:
If we show users what their dashboard could look like using demo data and place the "Connect Data Source" action directly in that context, users may be more motivated to connect their own data.
Experiment
We already had a Smart Report feature that could identify relevant widgets based on connected data sources.
I proposed using this capability earlier in the onboarding journey.
During onboarding, users would select the data sources they use. Once their account was created, we could automatically build their first dashboard using relevant widgets and metrics from those sources.
Instead of presenting users with an empty dashboard, we could immediately show them what their account could look like with their data connected.
Designing the Smart Dashboard
I designed the experience to collect the user's preferred data sources and then carry that information into their first experience inside the product.
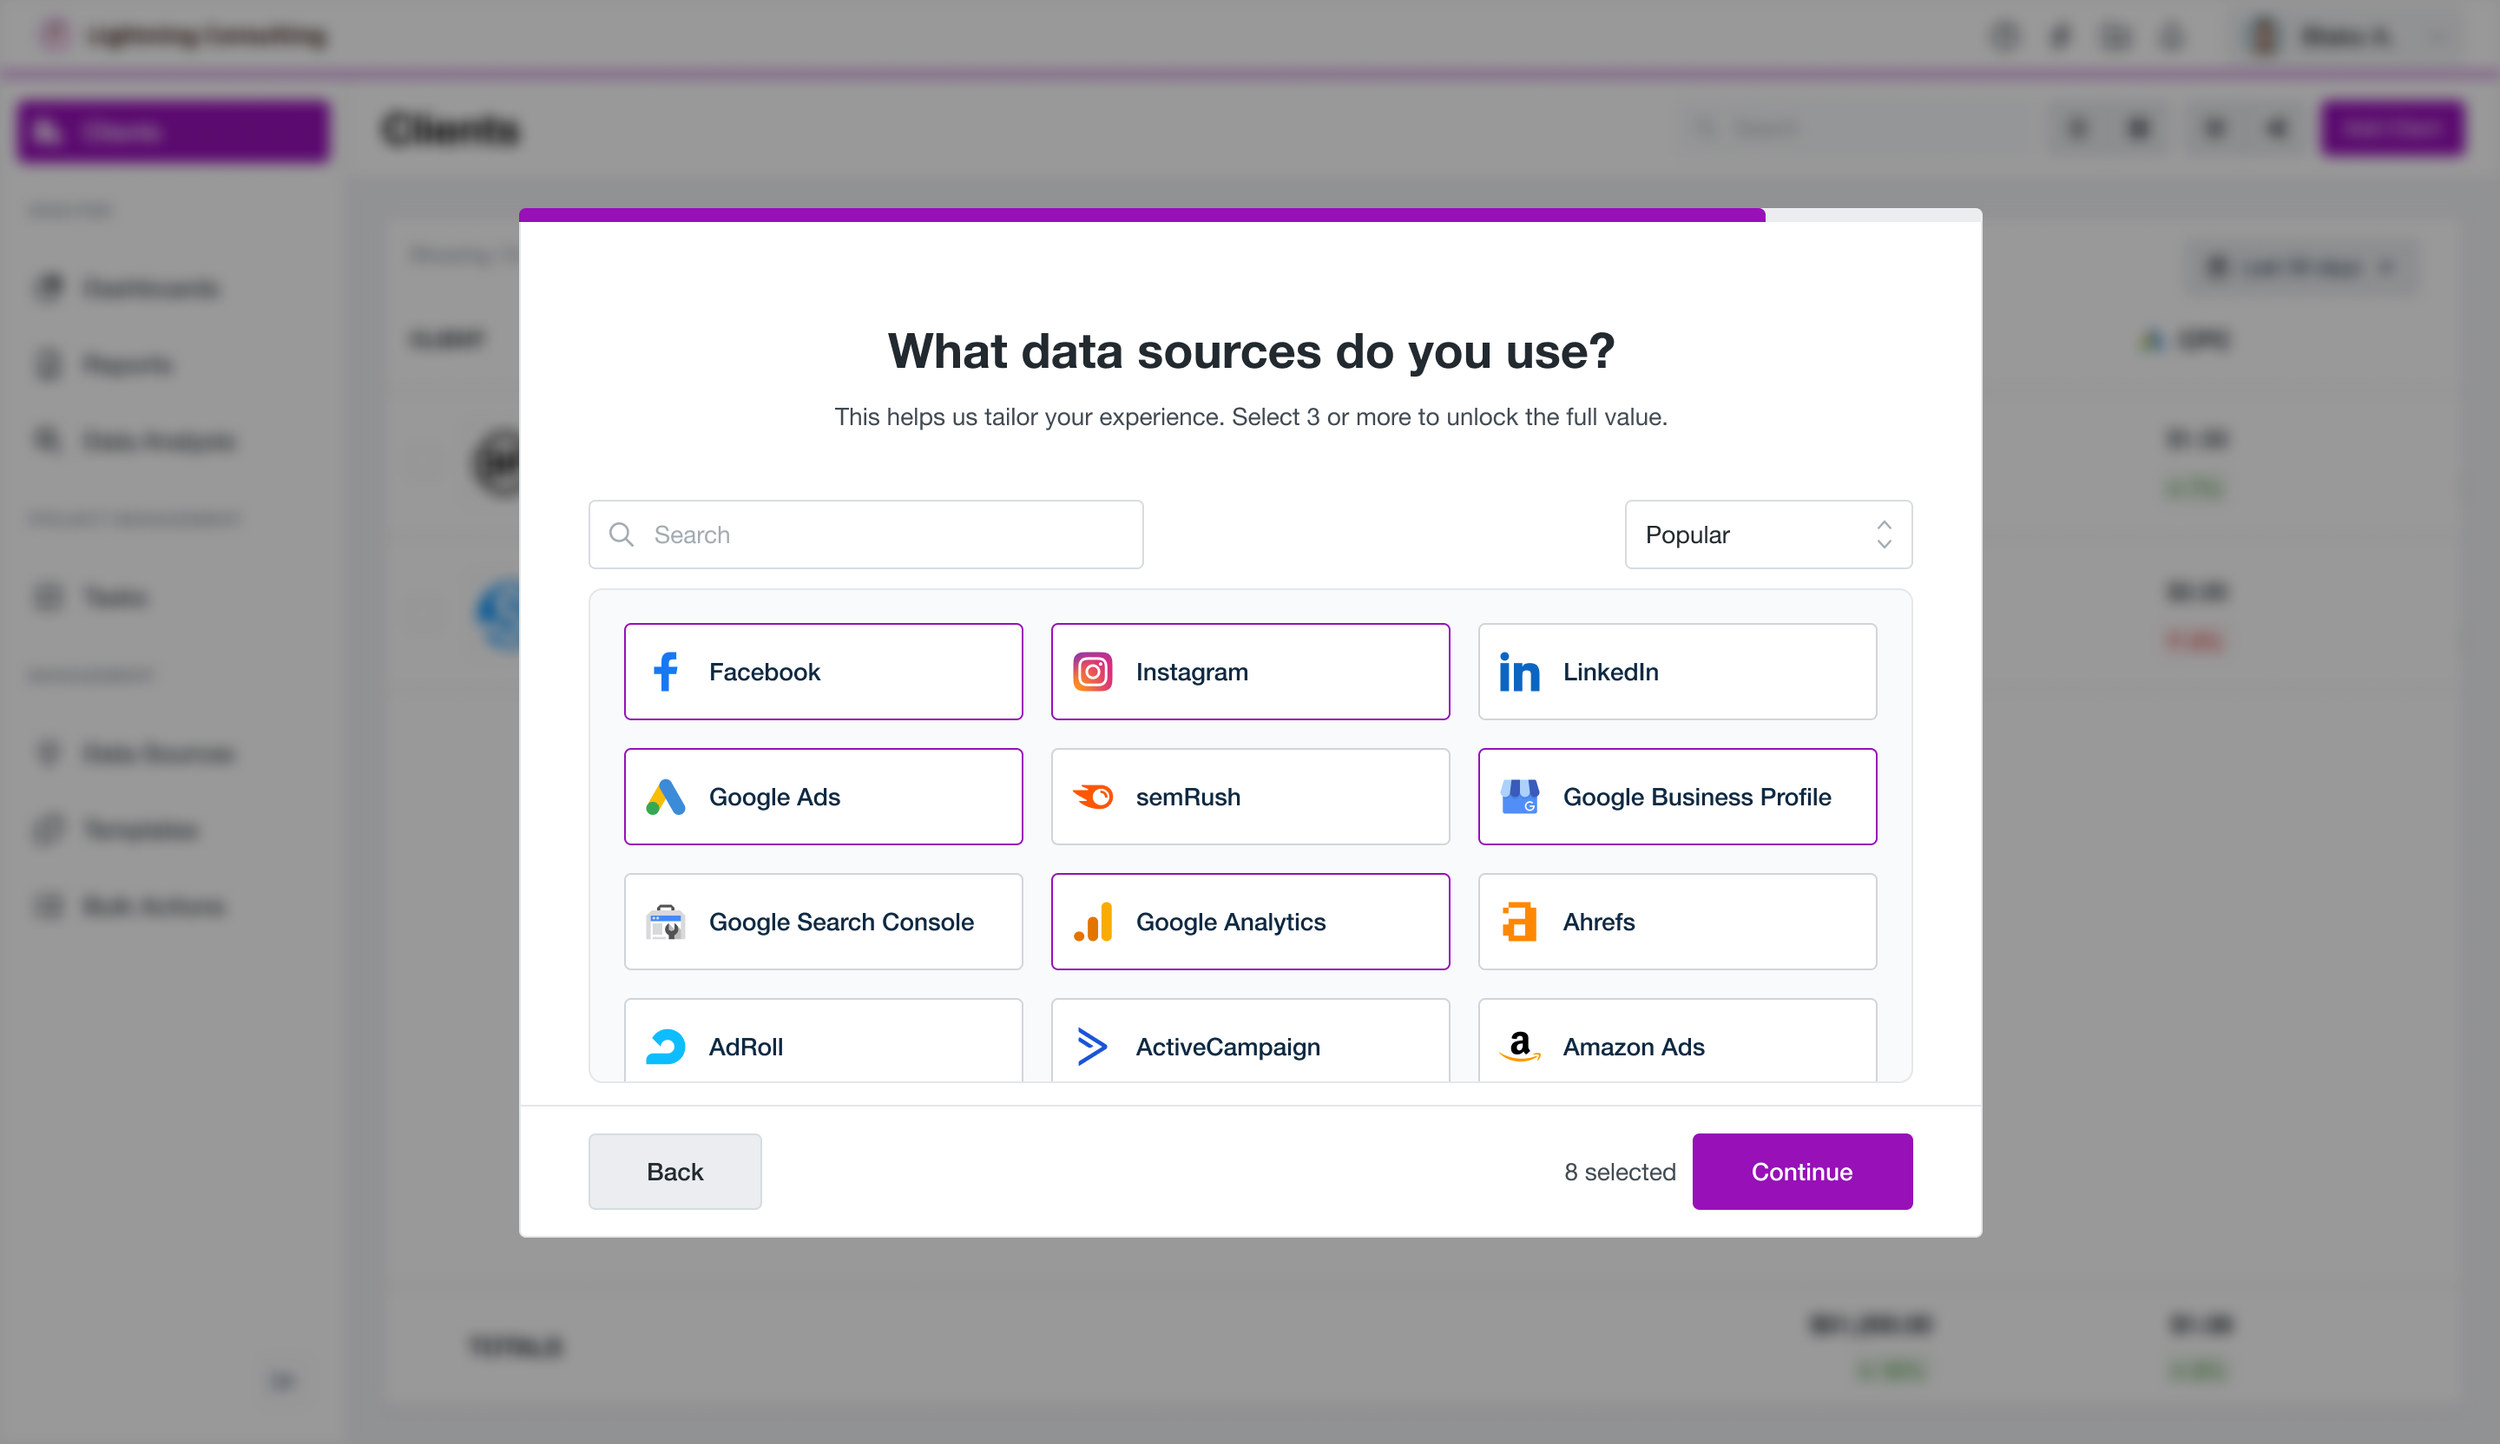
Start With Their Data
Select the data sources they use so we can build a dashboard around what matters to them.
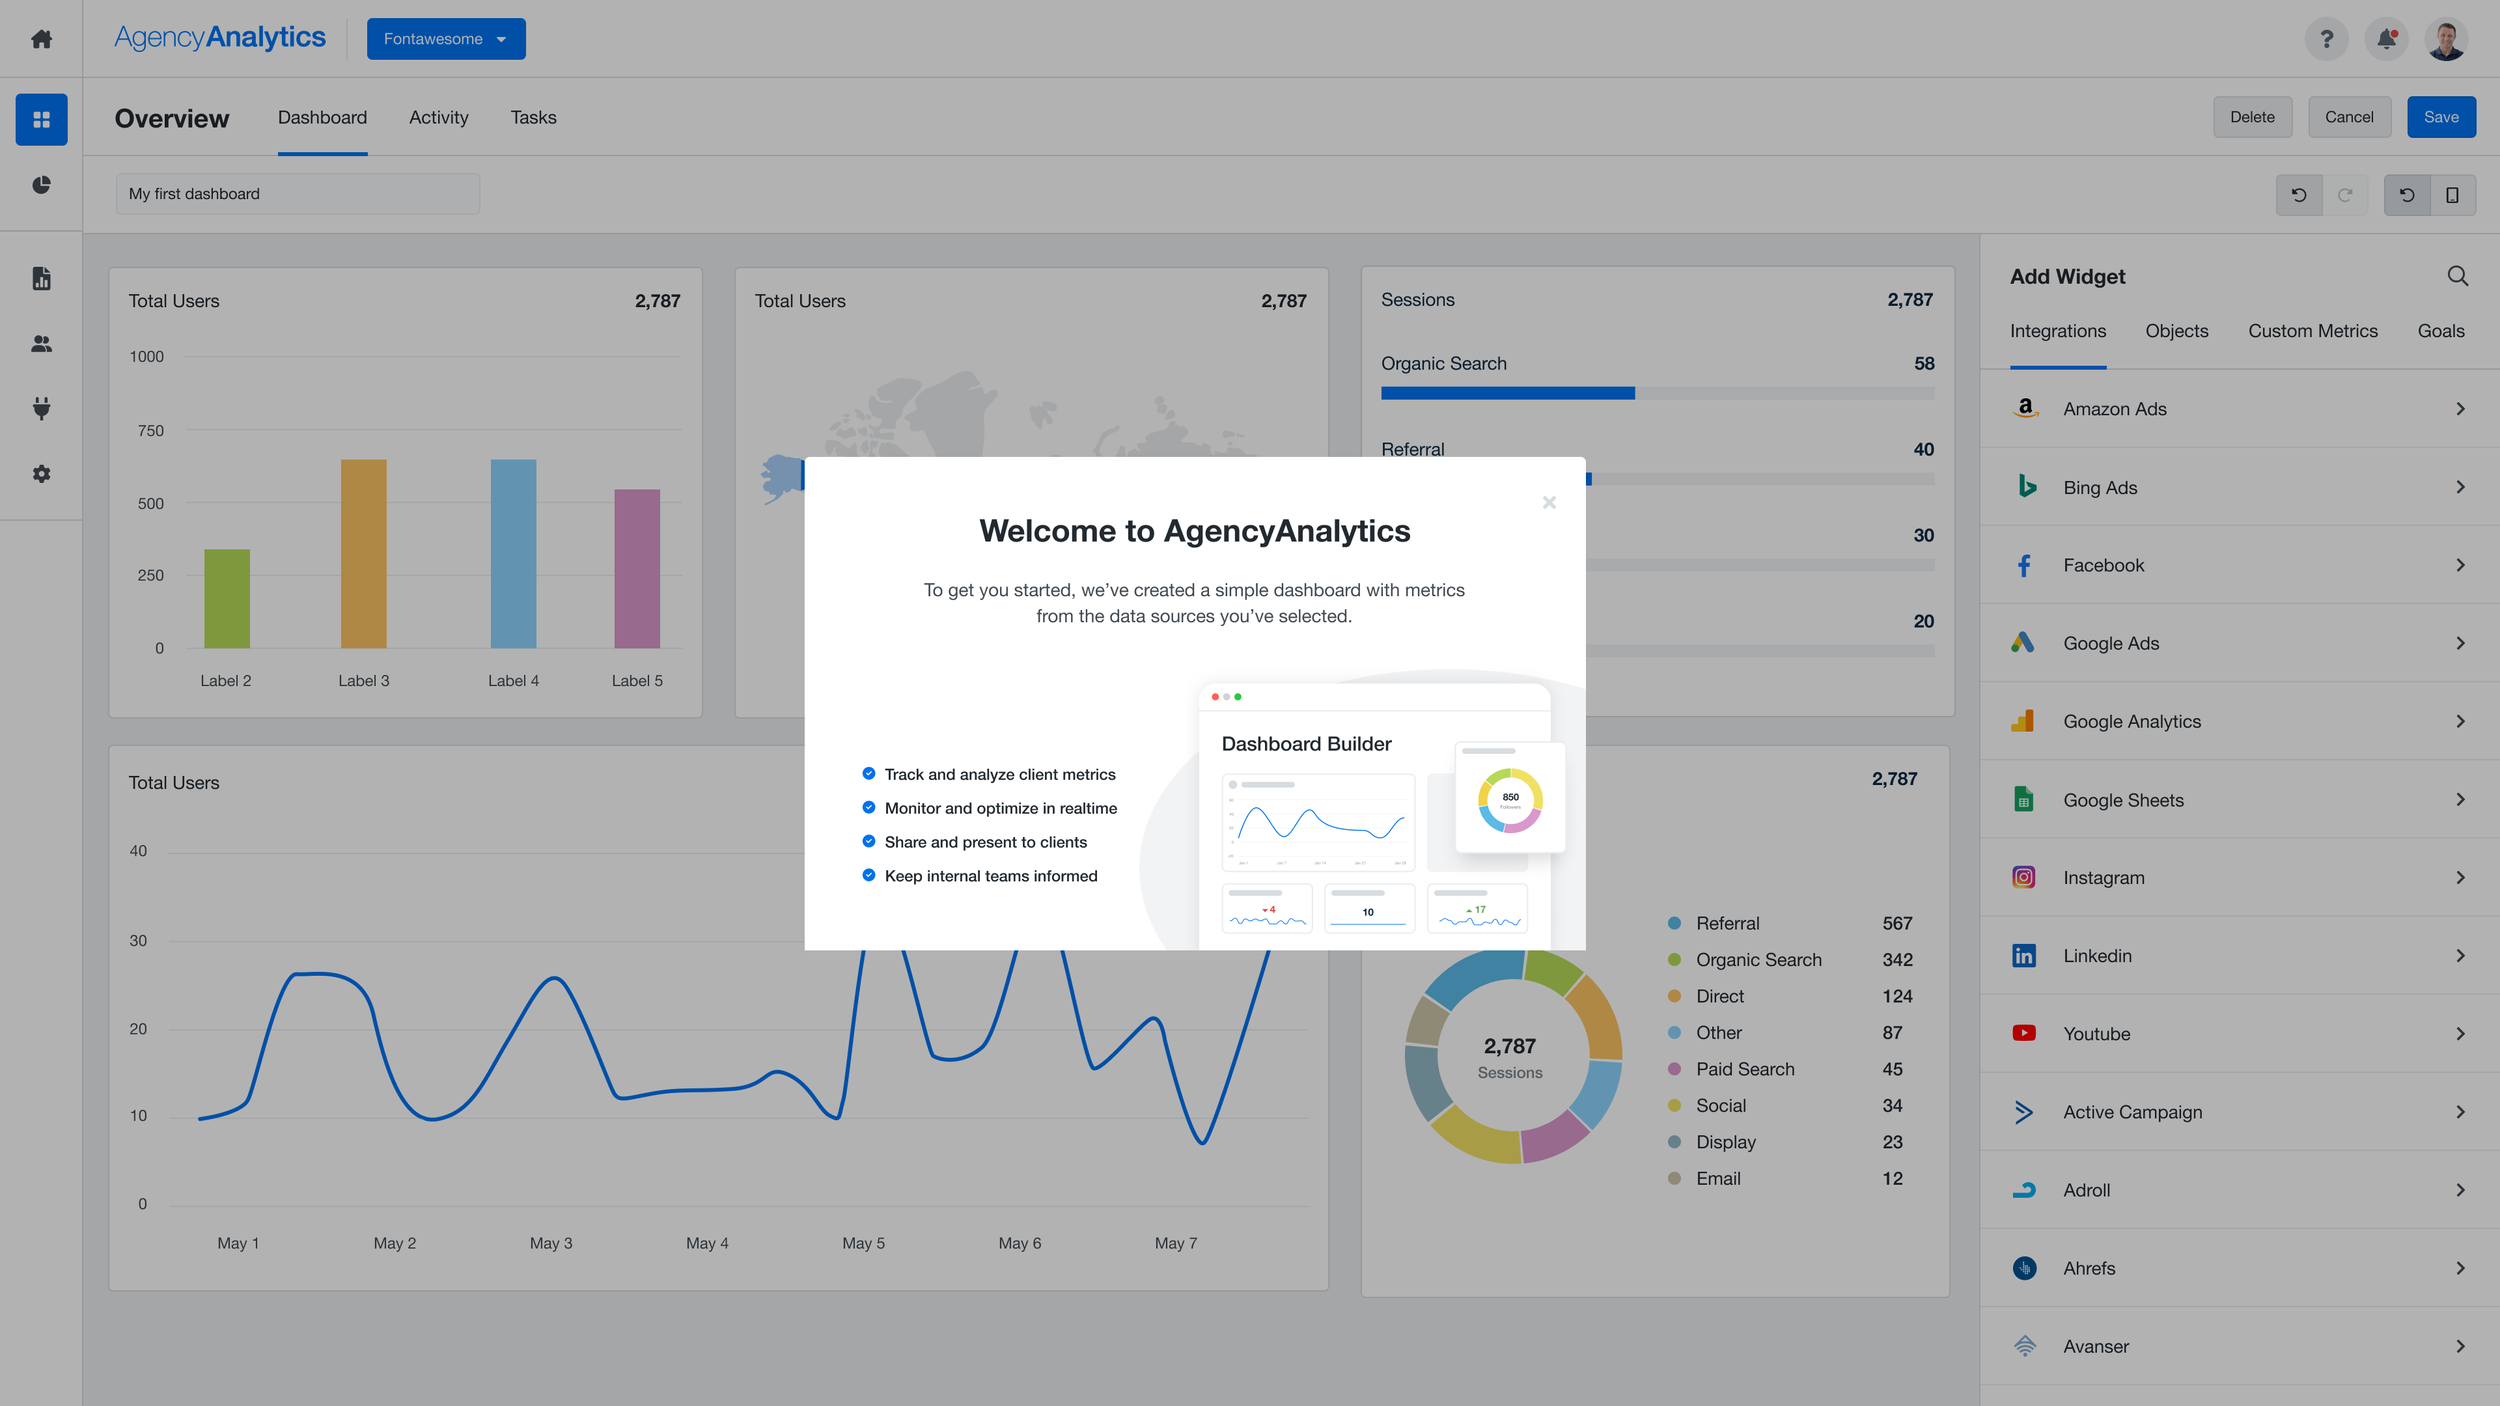
Set the Context
A welcome message explains that their dashboard has been created and what they’re seeing, giving them a clear starting point in the product.
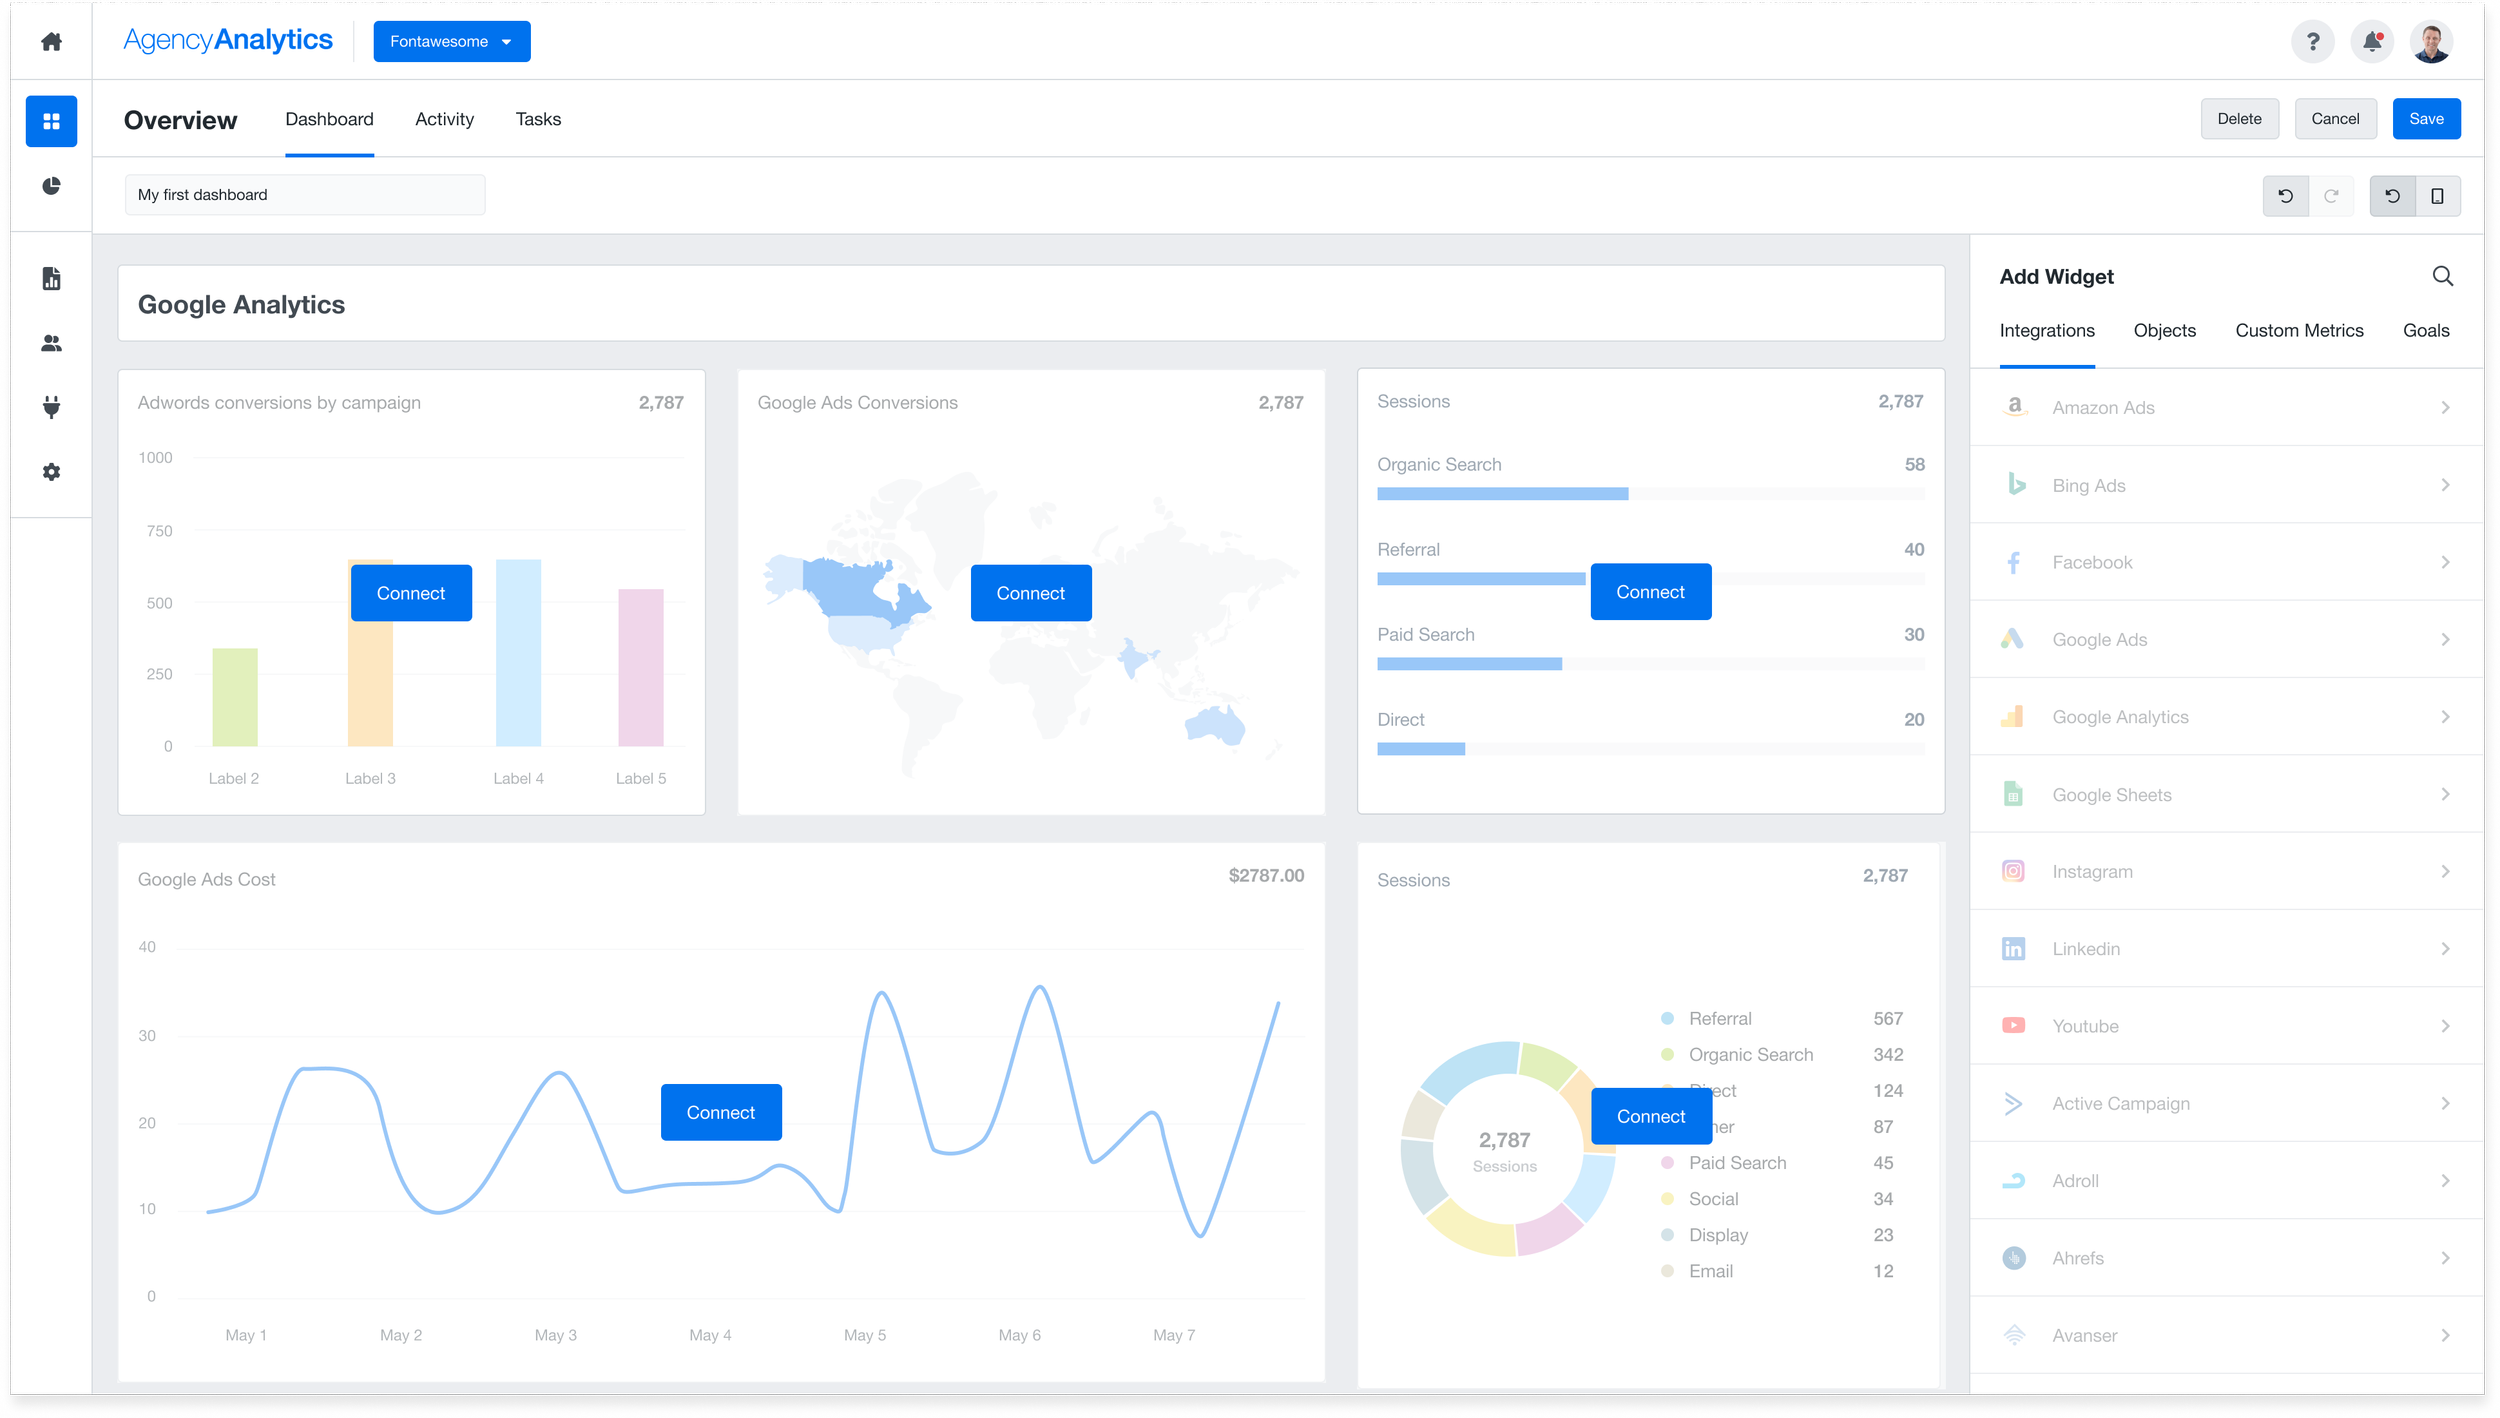
Show the Value
The Smart Dashboard is automatically populated with relevant widgets and demo data based on the data sources they selected.
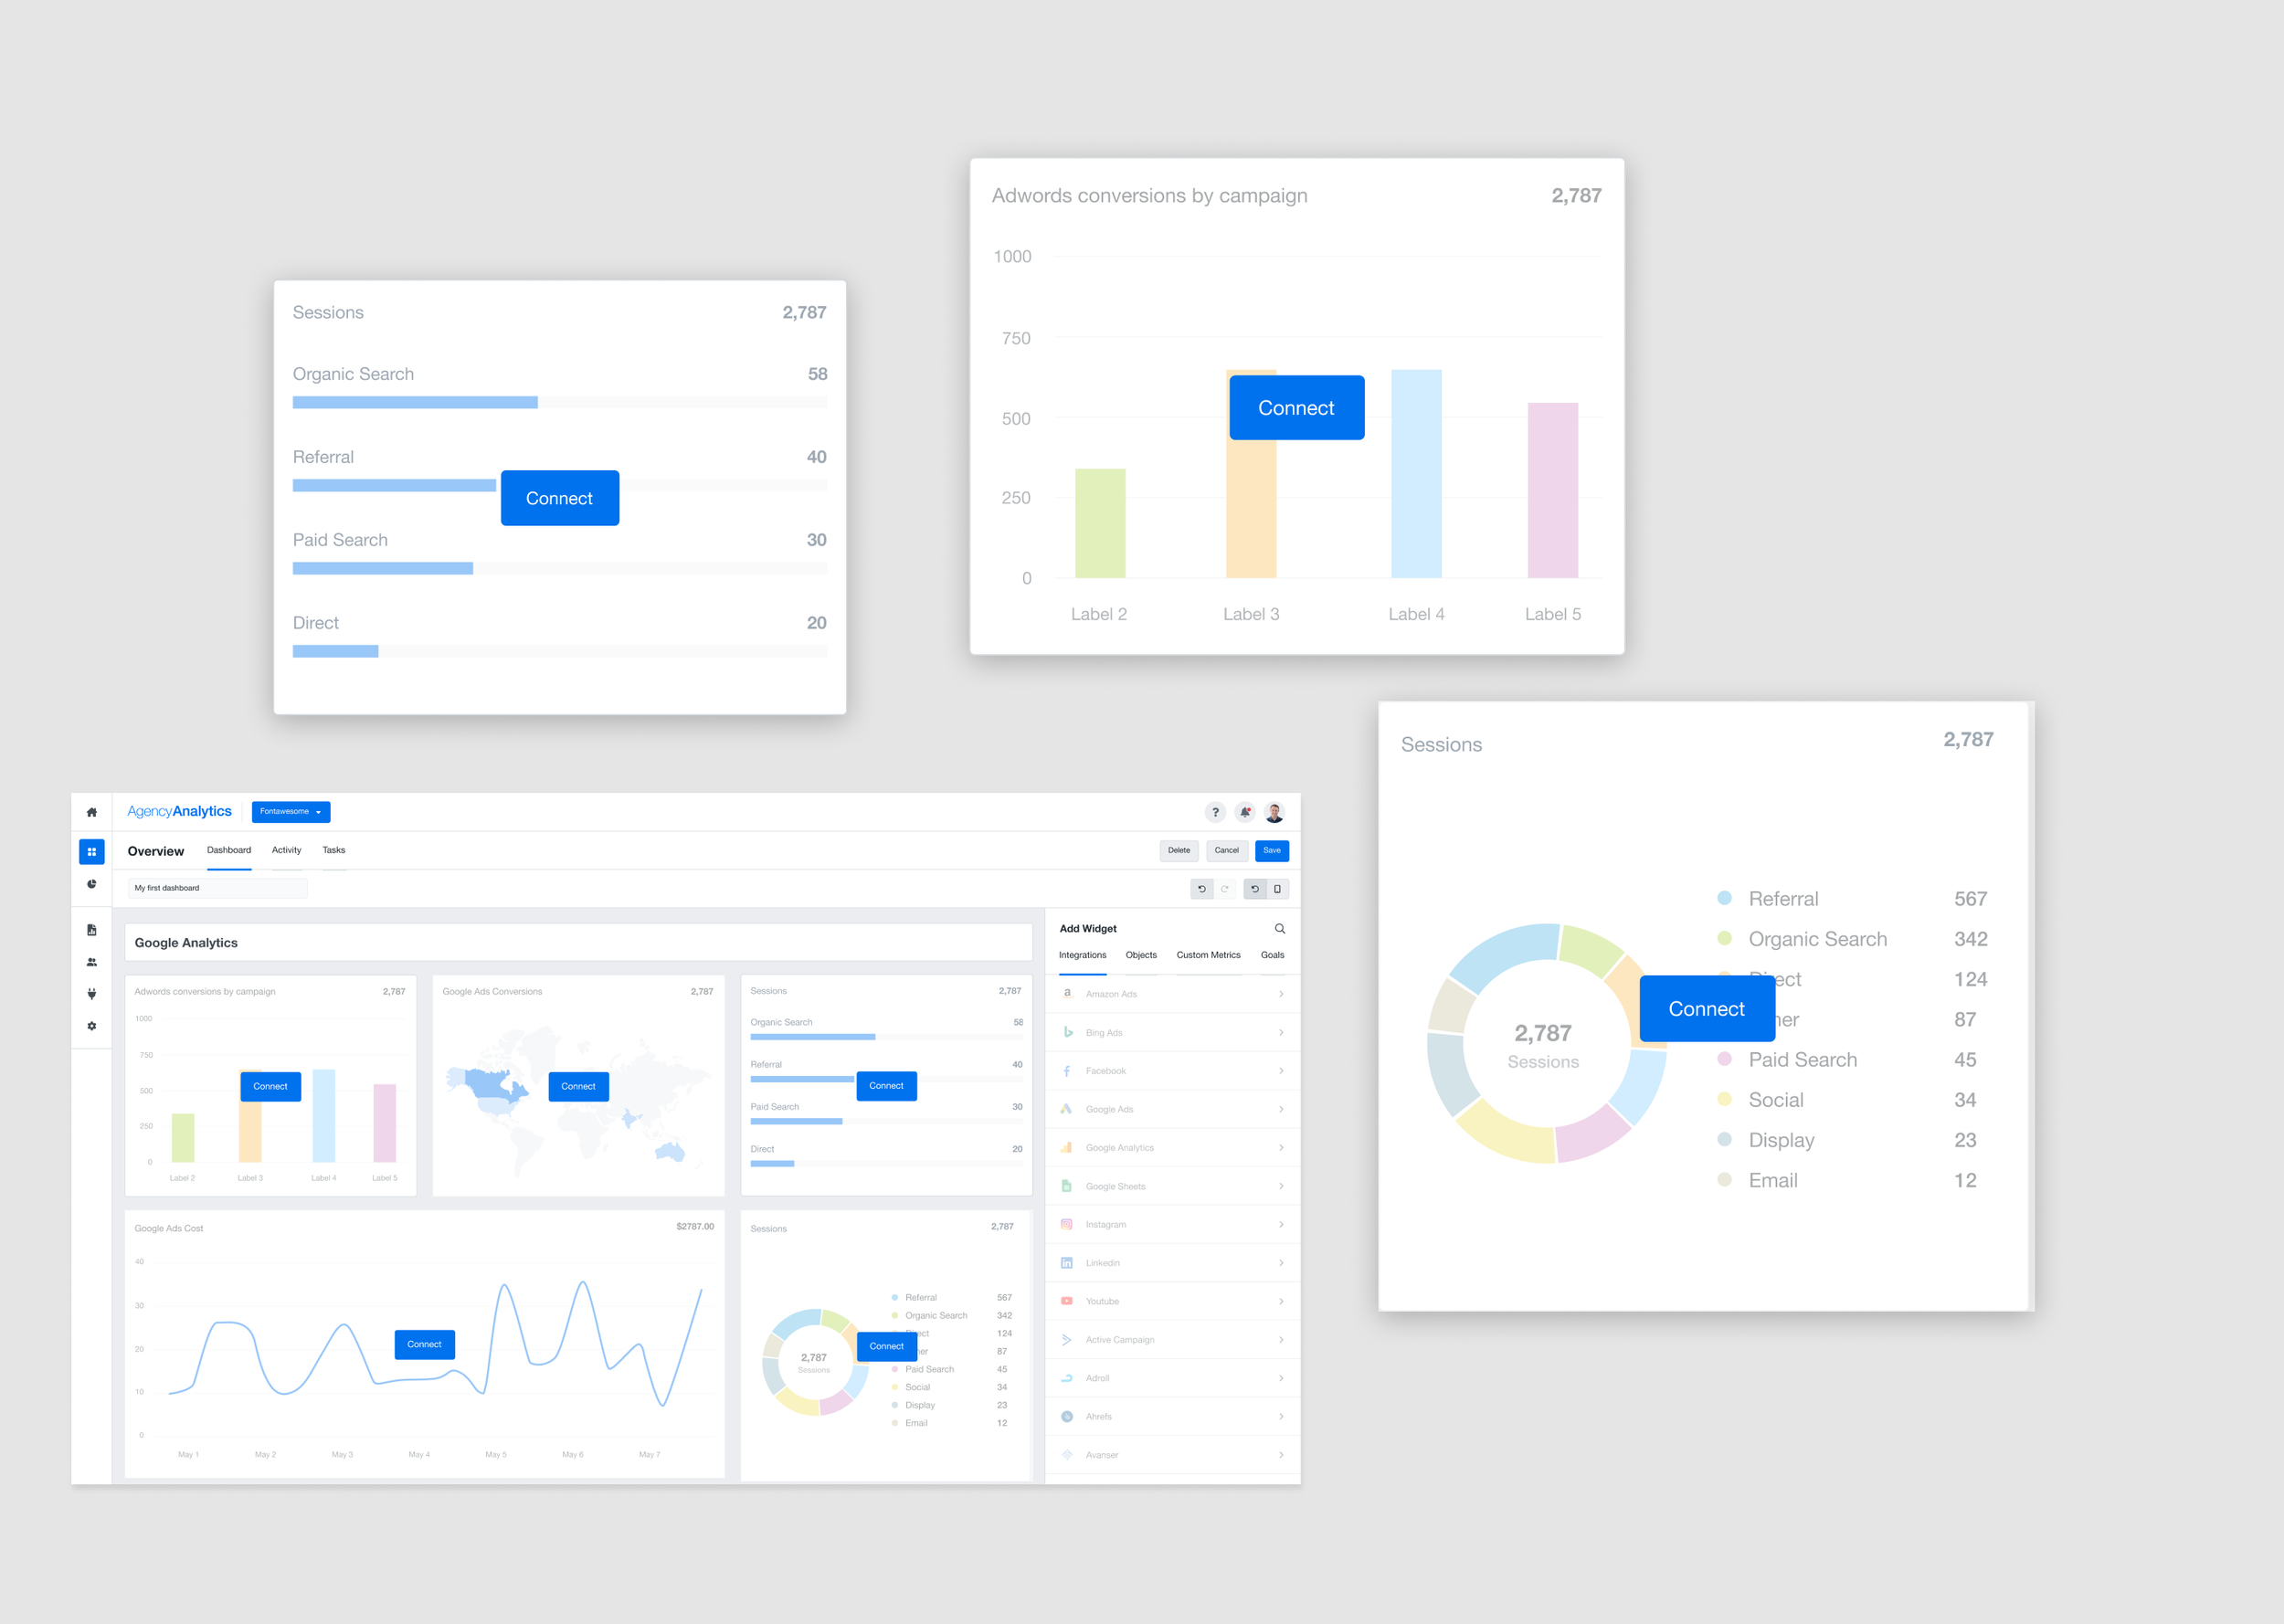
Connect in Context
Calls-to-action appear alongside the widgets, making it easy to connect their accounts and replace demo data with live data.
Turn Preview Into Reality
Once connected, the dashboard updates with their real data. Showing users the value of connecting their sources without leaving the experience.
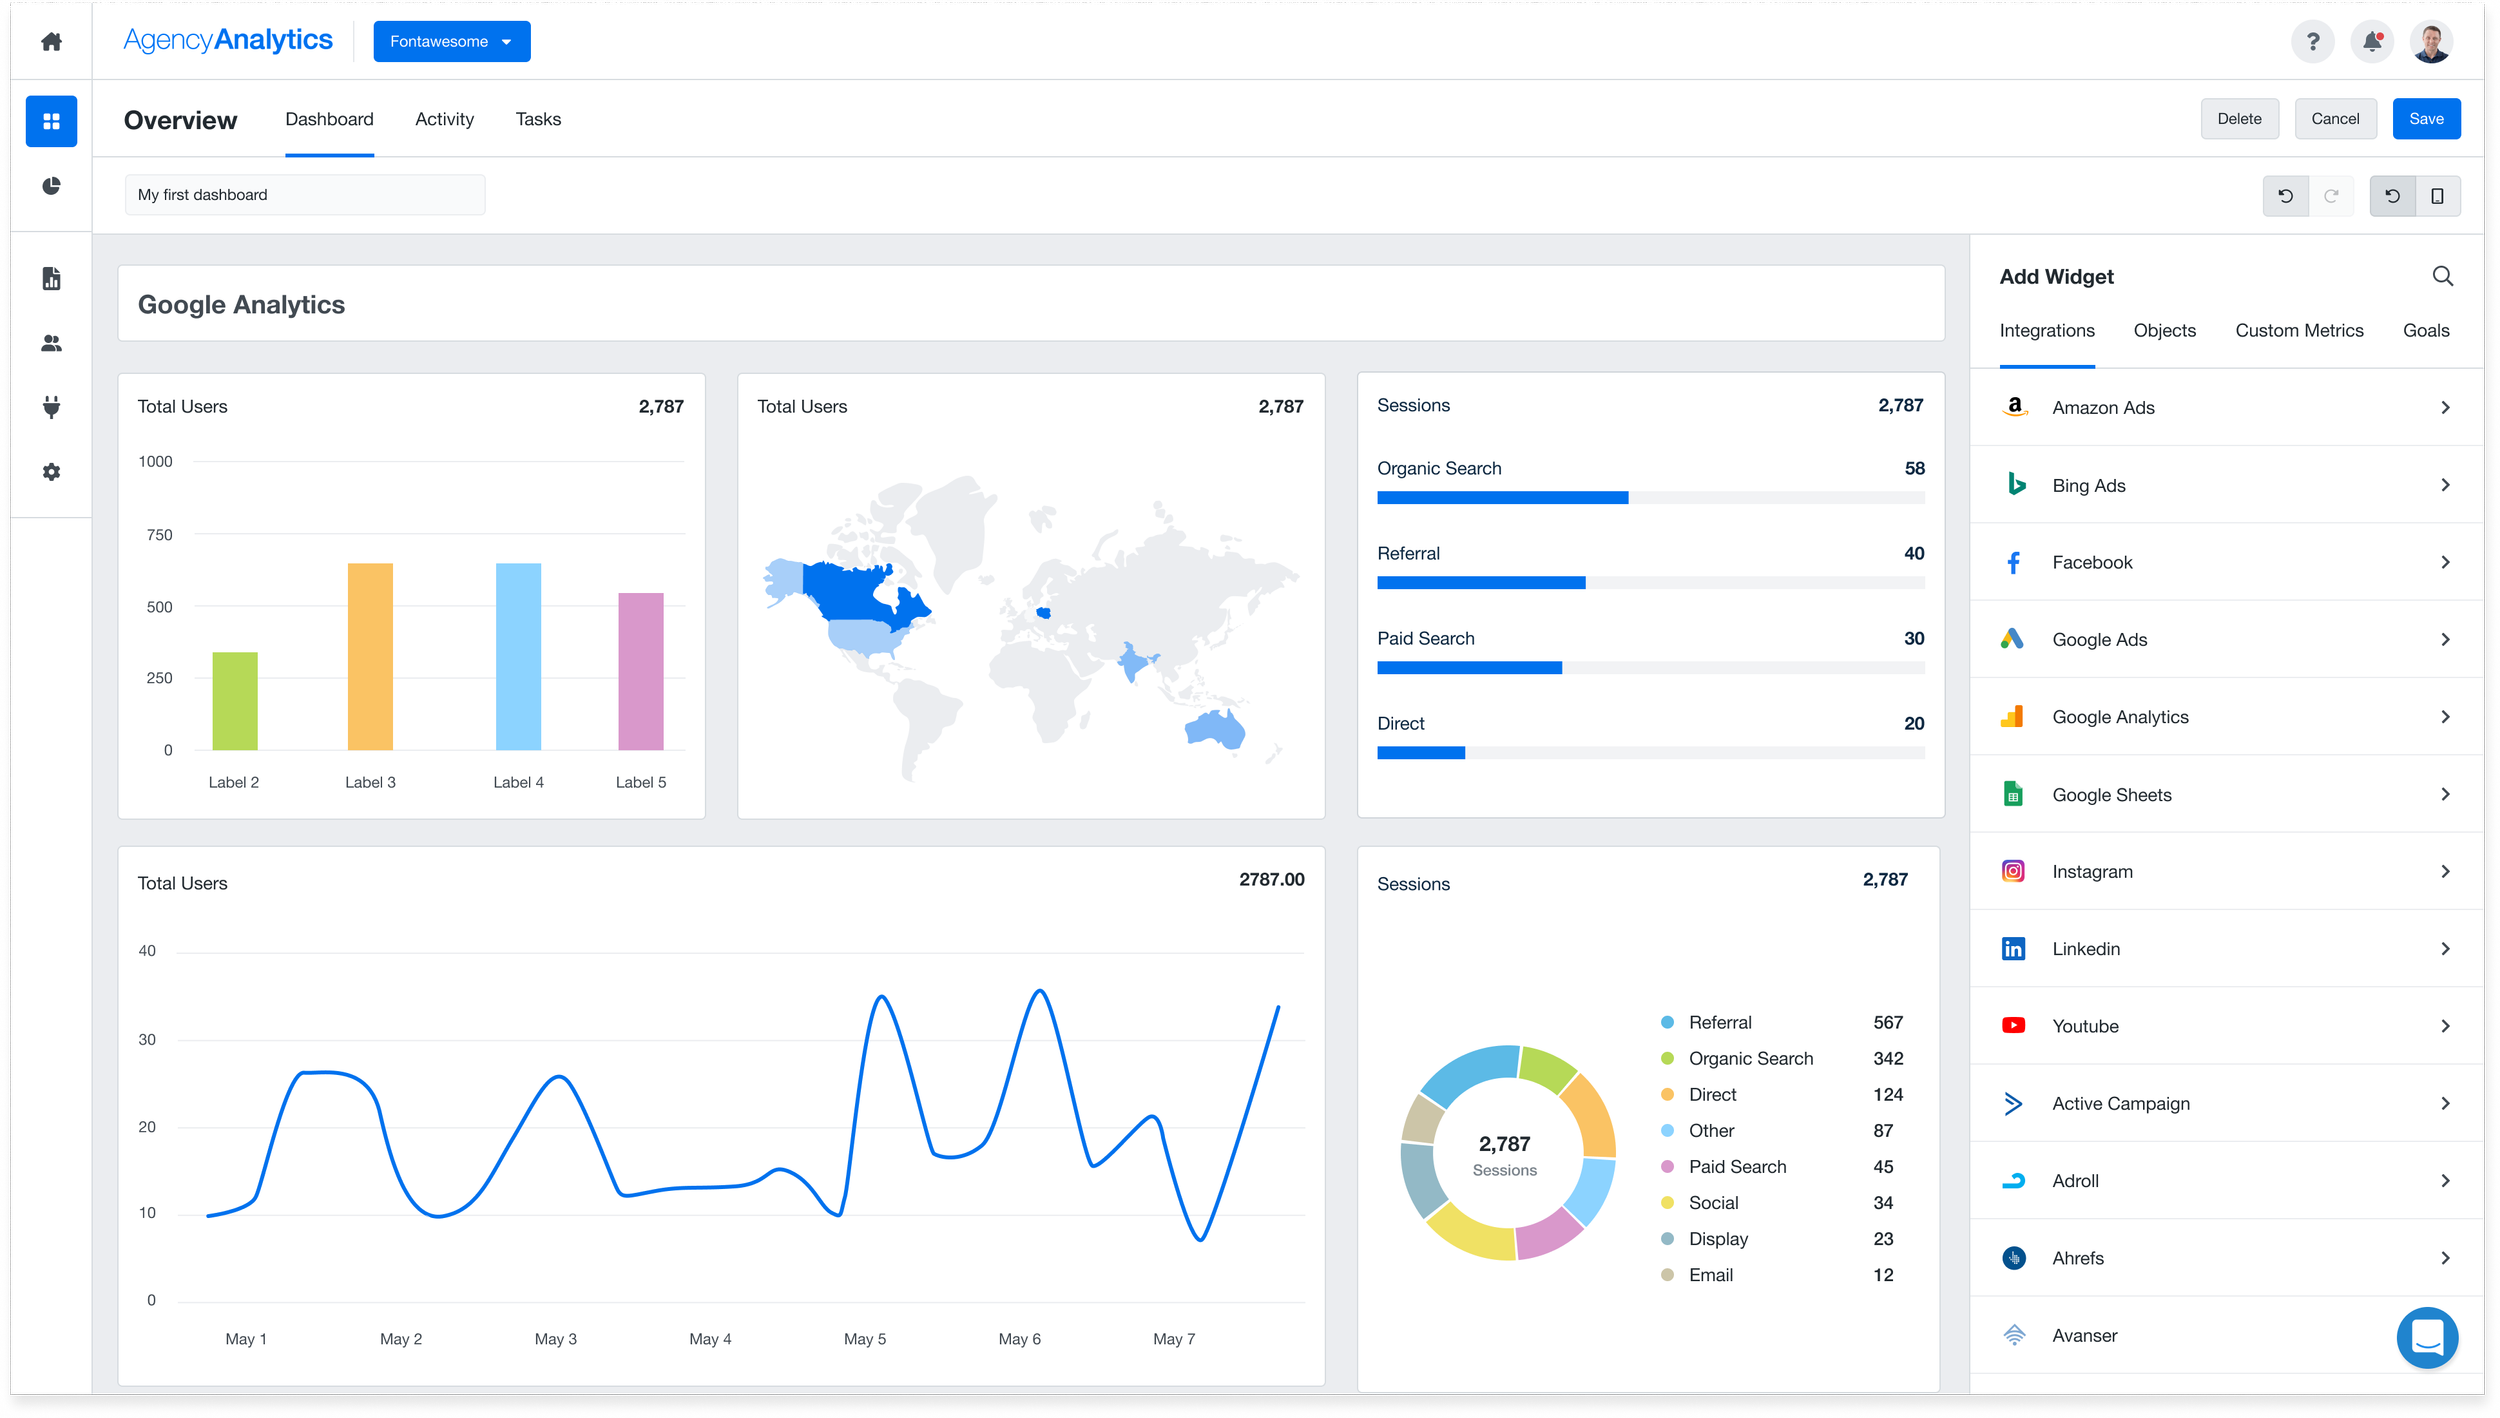
The key was putting the connection step in context.
Rather than telling users they needed to connect their data during onboarding, we could show them why they should.
Test
Turning Ideas Into Experiments
Because onboarding has such a significant impact on activation and conversion, we didn't want to make large changes without understanding their impact.
For each experiment, I documented:
The problem we were trying to solve
Our hypothesis
The expected outcome
The design being tested
The metrics we would use to evaluate success
I also built dashboards to monitor the results of our experiments.
This allowed the team to make decisions based on actual user behavior rather than relying solely on opinions or assumptions.
A/B Testing
We used A/B testing to validate changes within the onboarding funnel, making small, controlled changes so we could isolate their impact. Rather than changing multiple parts of the experience at once, we tested specific variables and measured how each affected key outcomes.
This gave us confidence in what was driving increases or decreases in performance and helped us determine whether each experiment was successful. We looked beyond onboarding completion to understand the impact on the broader funnel, including activation, conversion, and time to complete onboarding.
Implement
Implementation
For each experiment, I collaborated closely with developers during implementation.
I provided detailed specifications for my designs, answered questions, assisted with styling, and worked through implementation constraints with the team.
I also reviewed the experience throughout development to ensure the final implementation matched the intended user experience.
Once released, I monitored the results with the team and used the data to determine what we should learn, change, or test next.
Some final designs
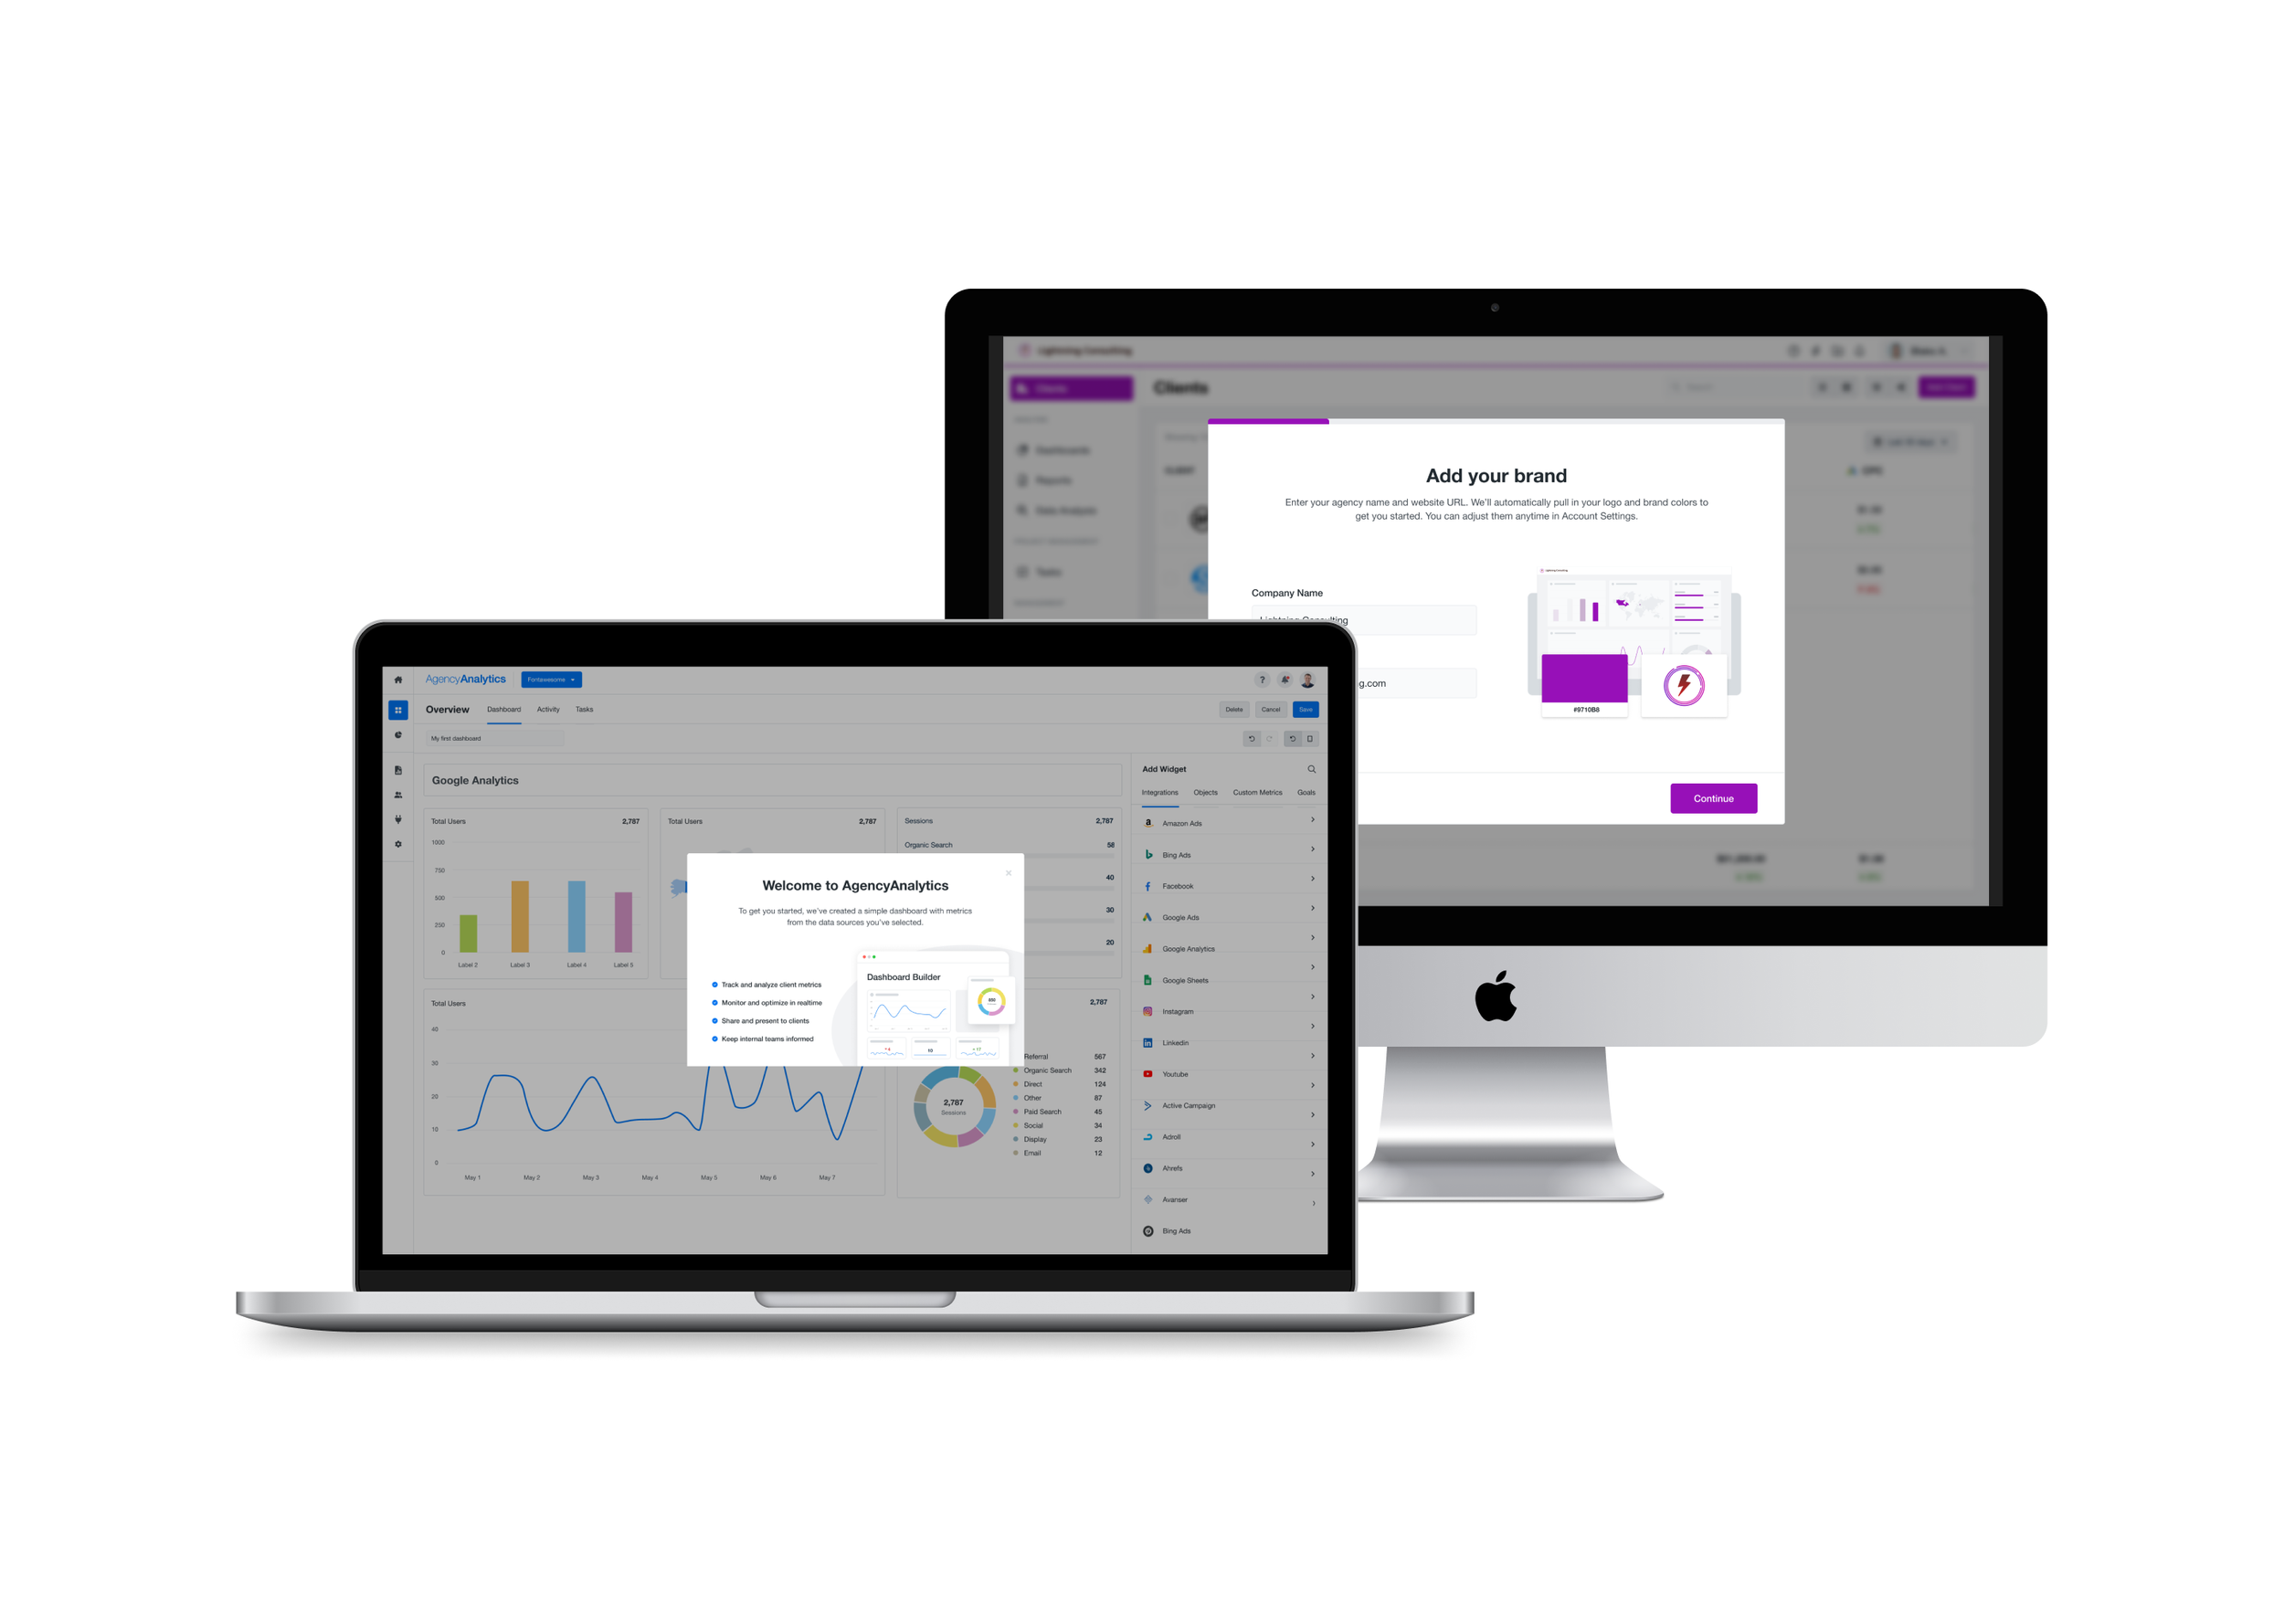
The final onboarding experience guided users through a lightweight setup process, captured the data sources they use, and used that information to automatically create a relevant first dashboard.
Instead of arriving at an empty product, users immediately saw a dashboard containing relevant metrics and demo data.
The experience then encouraged them to connect their own data sources so they could replace the demo data with their actual marketing data.
This created a much clearer path:
Select your data sources → See what your dashboard could look like → Connect your data → Experience the value
Results
- Increased Trial-to-Paid Conversion: Trial-to-paid conversions increased by 25.5%, demonstrating a meaningful business impact from improving the onboarding experience.
- Increased Activation: Activation increased by 92%, while time-to-activation decreased from 5.3 days to 1.2 days.
- Earlier Data Connection: Users began connecting their data sources earlier in their trial, helping them reach the product's value sooner.
- Faster Path to Five Data Sources: The Smart Dashboard helped significantly reduce the time it took users to connect multiple data sources, moving users toward the five-source threshold associated with stronger conversion and retention.
- Better Understanding of Our Users: The new segmentation and intent questions gave the team significantly more insight into who was entering the product and how they intended to use it.
These insights influenced conversations across marketing and product around attribution, segmentation, ICP definition, and the potential opportunity to better support emerging user segments.
What I learned
This project reinforced how powerful small, measurable experiments can be. Rather than trying to redesign the entire onboarding experience at once, we were able to make smaller changes, establish hypotheses, measure the results, and use what we learned to inform the next experiment.
Onboarding isn't just a design problem. Changes to onboarding can influence activation, conversion, marketing strategy, customer understanding, segmentation, and even product strategy. That made cross-functional collaboration especially important. Working closely with product, analytics, marketing, and engineering allowed us to understand the broader impact of our decisions rather than optimizing the experience in isolation.
Most importantly, the project reinforced the importance of continually learning about your customers. As customer needs, acquisition channels, and the market change, the assumptions we build our products around can change too. Good onboarding should evolve alongside them.

